QUESTION IMAGE
Question
question 2 / 2
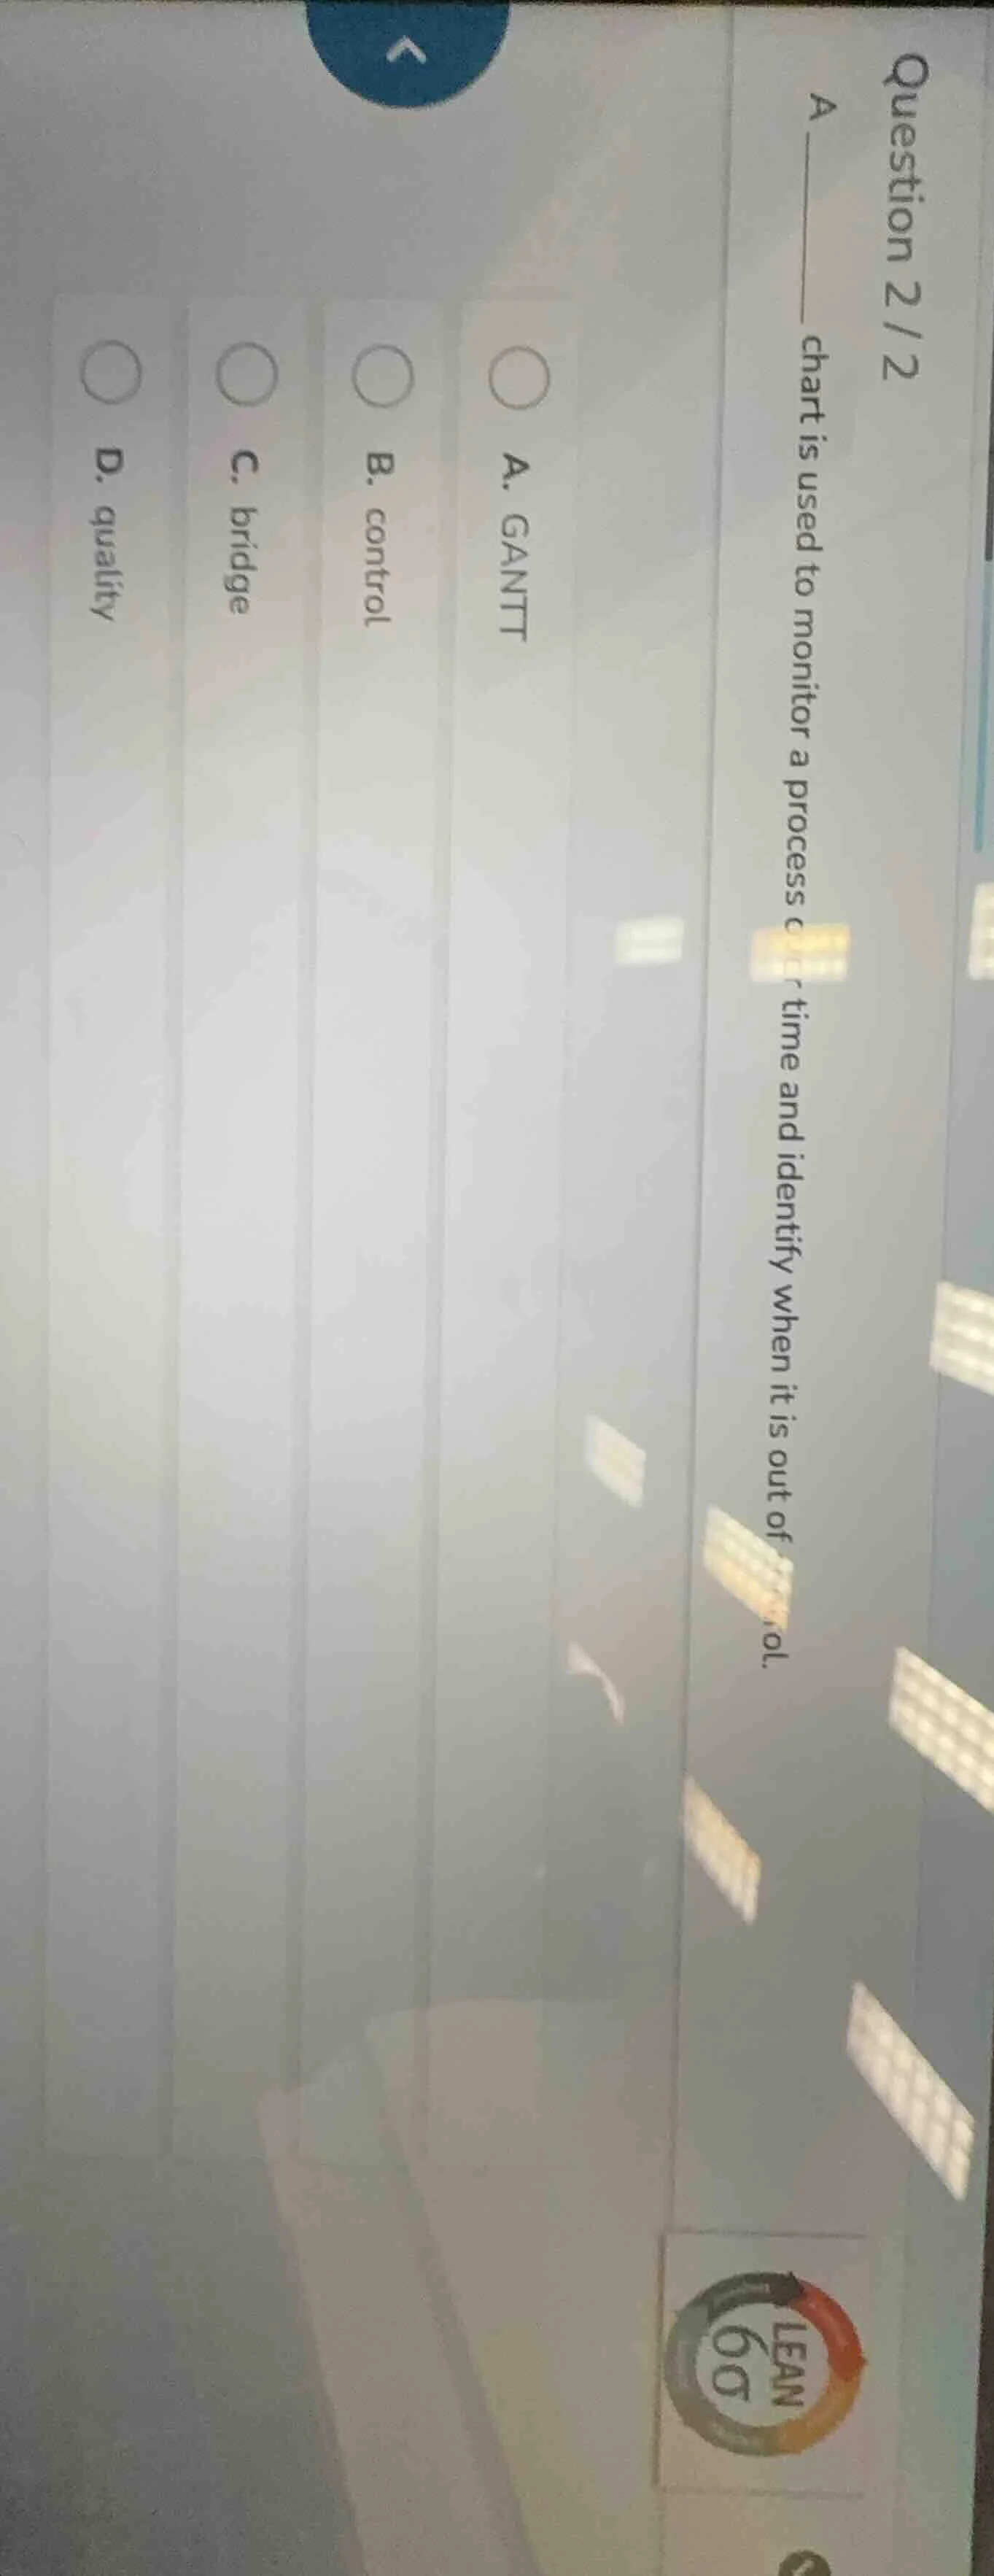
a ____ chart is used to monitor a process over time and identify when it is out of control.
a. gantt
b. control
c. bridge
d. quality
The question is about a chart used to monitor a process over time and identify when it's out of control. A control chart (also known as a Shewhart chart) is a statistical tool used for this purpose. A GANTT chart is for project scheduling, "bridge" and "quality" don't fit the description of a chart for process control over time. So the correct option related to process control monitoring is B (control, likely referring to control chart).

Snap & solve any problem in the app
Get step-by-step solutions on Sovi AI
Photo-based solutions with guided steps
Explore more problems and detailed explanations
B. control