QUESTION IMAGE
Question
Question was provided via image upload.
Identify the market and axes
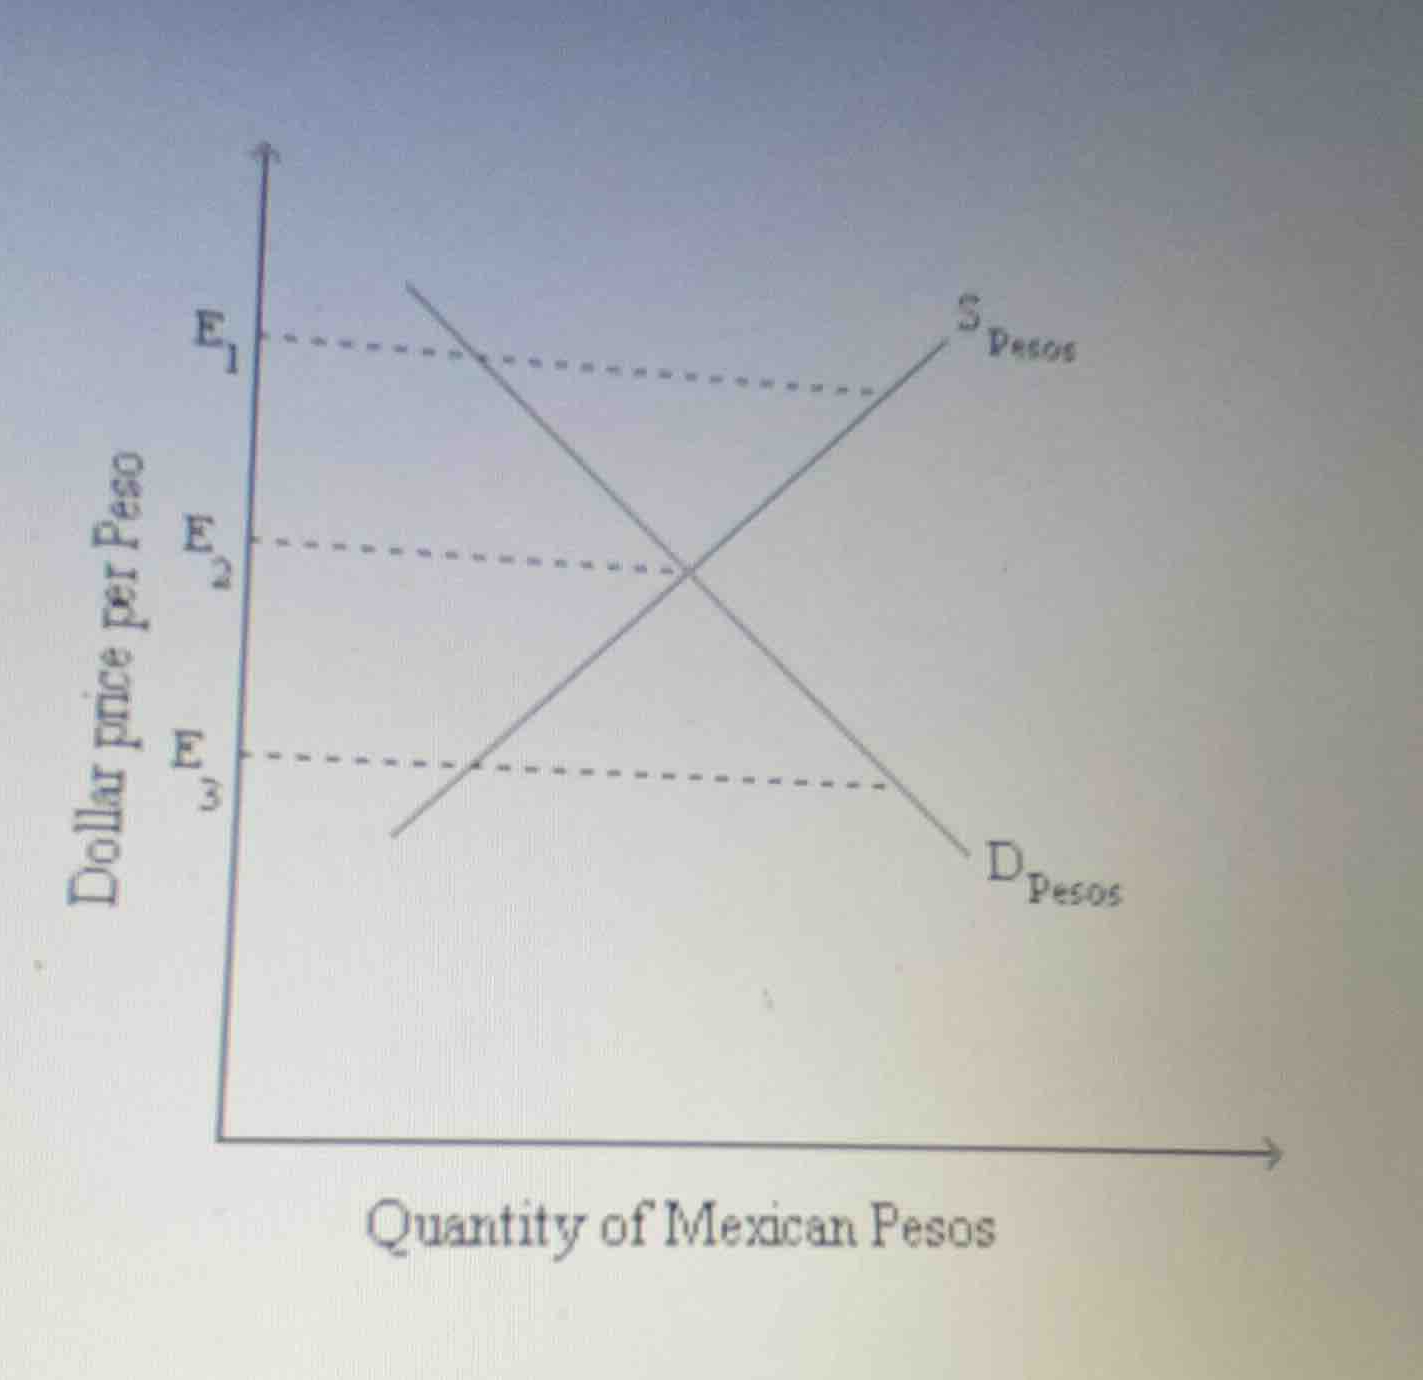
The graph represents the foreign exchange market for Mexican Pesos.
The vertical axis shows the exchange rate, expressed as the "Dollar price per Peso" (\(E\)).
The horizontal axis shows the "Quantity of Mexican Pesos".
Analyze supply and demand curves
The downward-sloping curve \(D_{\text{Pesos}}\) represents the demand for Mexican Pesos.
The upward-sloping curve \(S_{\text{Pesos}}\) represents the supply of Mexican Pesos.
Determine the equilibrium exchange rate
The equilibrium exchange rate is determined at the intersection of the demand curve \(D_{\text{Pesos}}\) and the supply curve \(S_{\text{Pesos}}\).
This intersection point aligns horizontally with the exchange rate \(E_2\) on the vertical axis.

Snap & solve any problem in the app
Get step-by-step solutions on Sovi AI
Photo-based solutions with guided steps
Explore more problems and detailed explanations
The equilibrium exchange rate in this foreign exchange market is \(E_2\).