QUESTION IMAGE
Question
Question was provided via image upload.
⚡ Using what you learned: Graphing Trigonometric Functions
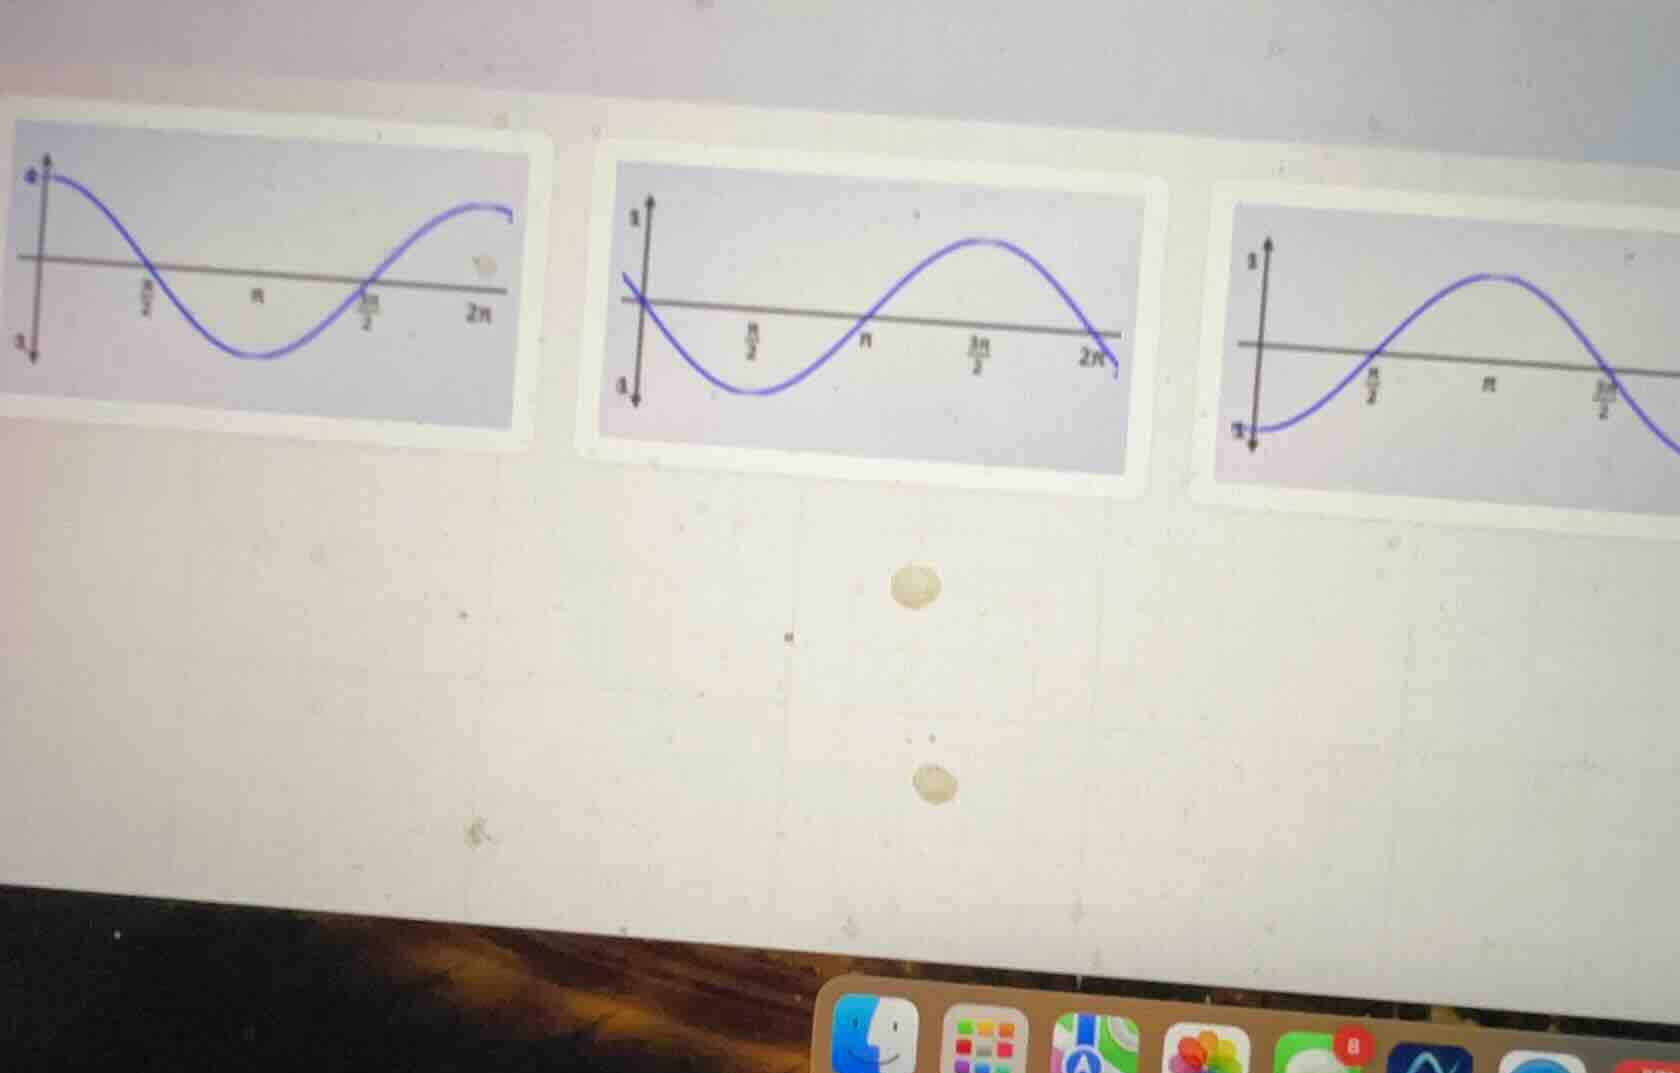
Step 1: Identify key features of the first graph (left)
- \(y\)-intercept: The curve starts at its maximum value of \(1\) when \(x = 0\).
- Shape: It starts at a peak, goes down to a minimum at \(\pi\), and returns near its peak at \(2\pi\).
- Function: This represents the standard cosine function:
$$ y = \cos(x) $$
Step 2: Identify key features of the second graph (middle)
- \(y\)-intercept: The curve starts at \(0\) when \(x = 0\) and immediately goes downward.
- Shape: It reaches a minimum at \(\frac{\pi}{2}\), crosses the \(x\)-axis at \(\pi\), reaches a maximum at \(\frac{3\pi}{2}\), and returns to \(0\) at \(2\pi\).
- Function: This is a vertically reflected sine wave:
$$ y = -\sin(x) $$
Step 3: Identify key features of the third graph (right)
- \(y\)-intercept: The curve starts at its minimum value of \(-1\) when \(x = 0\).
- Shape: It starts at a trough, rises to a maximum at \(\pi\), and goes back down.
- Function: This is a vertically reflected cosine wave:
$$ y = -\cos(x) $$

Snap & solve any problem in the app
Get step-by-step solutions on Sovi AI
Photo-based solutions with guided steps
Explore more problems and detailed explanations
- Left Graph: \(y = \cos(x)\)
- Middle Graph: \(y = -\sin(x)\)
- Right Graph: \(y = -\cos(x)\)