QUESTION IMAGE
Question
Question was provided via image upload.
Analyze the infographic categories
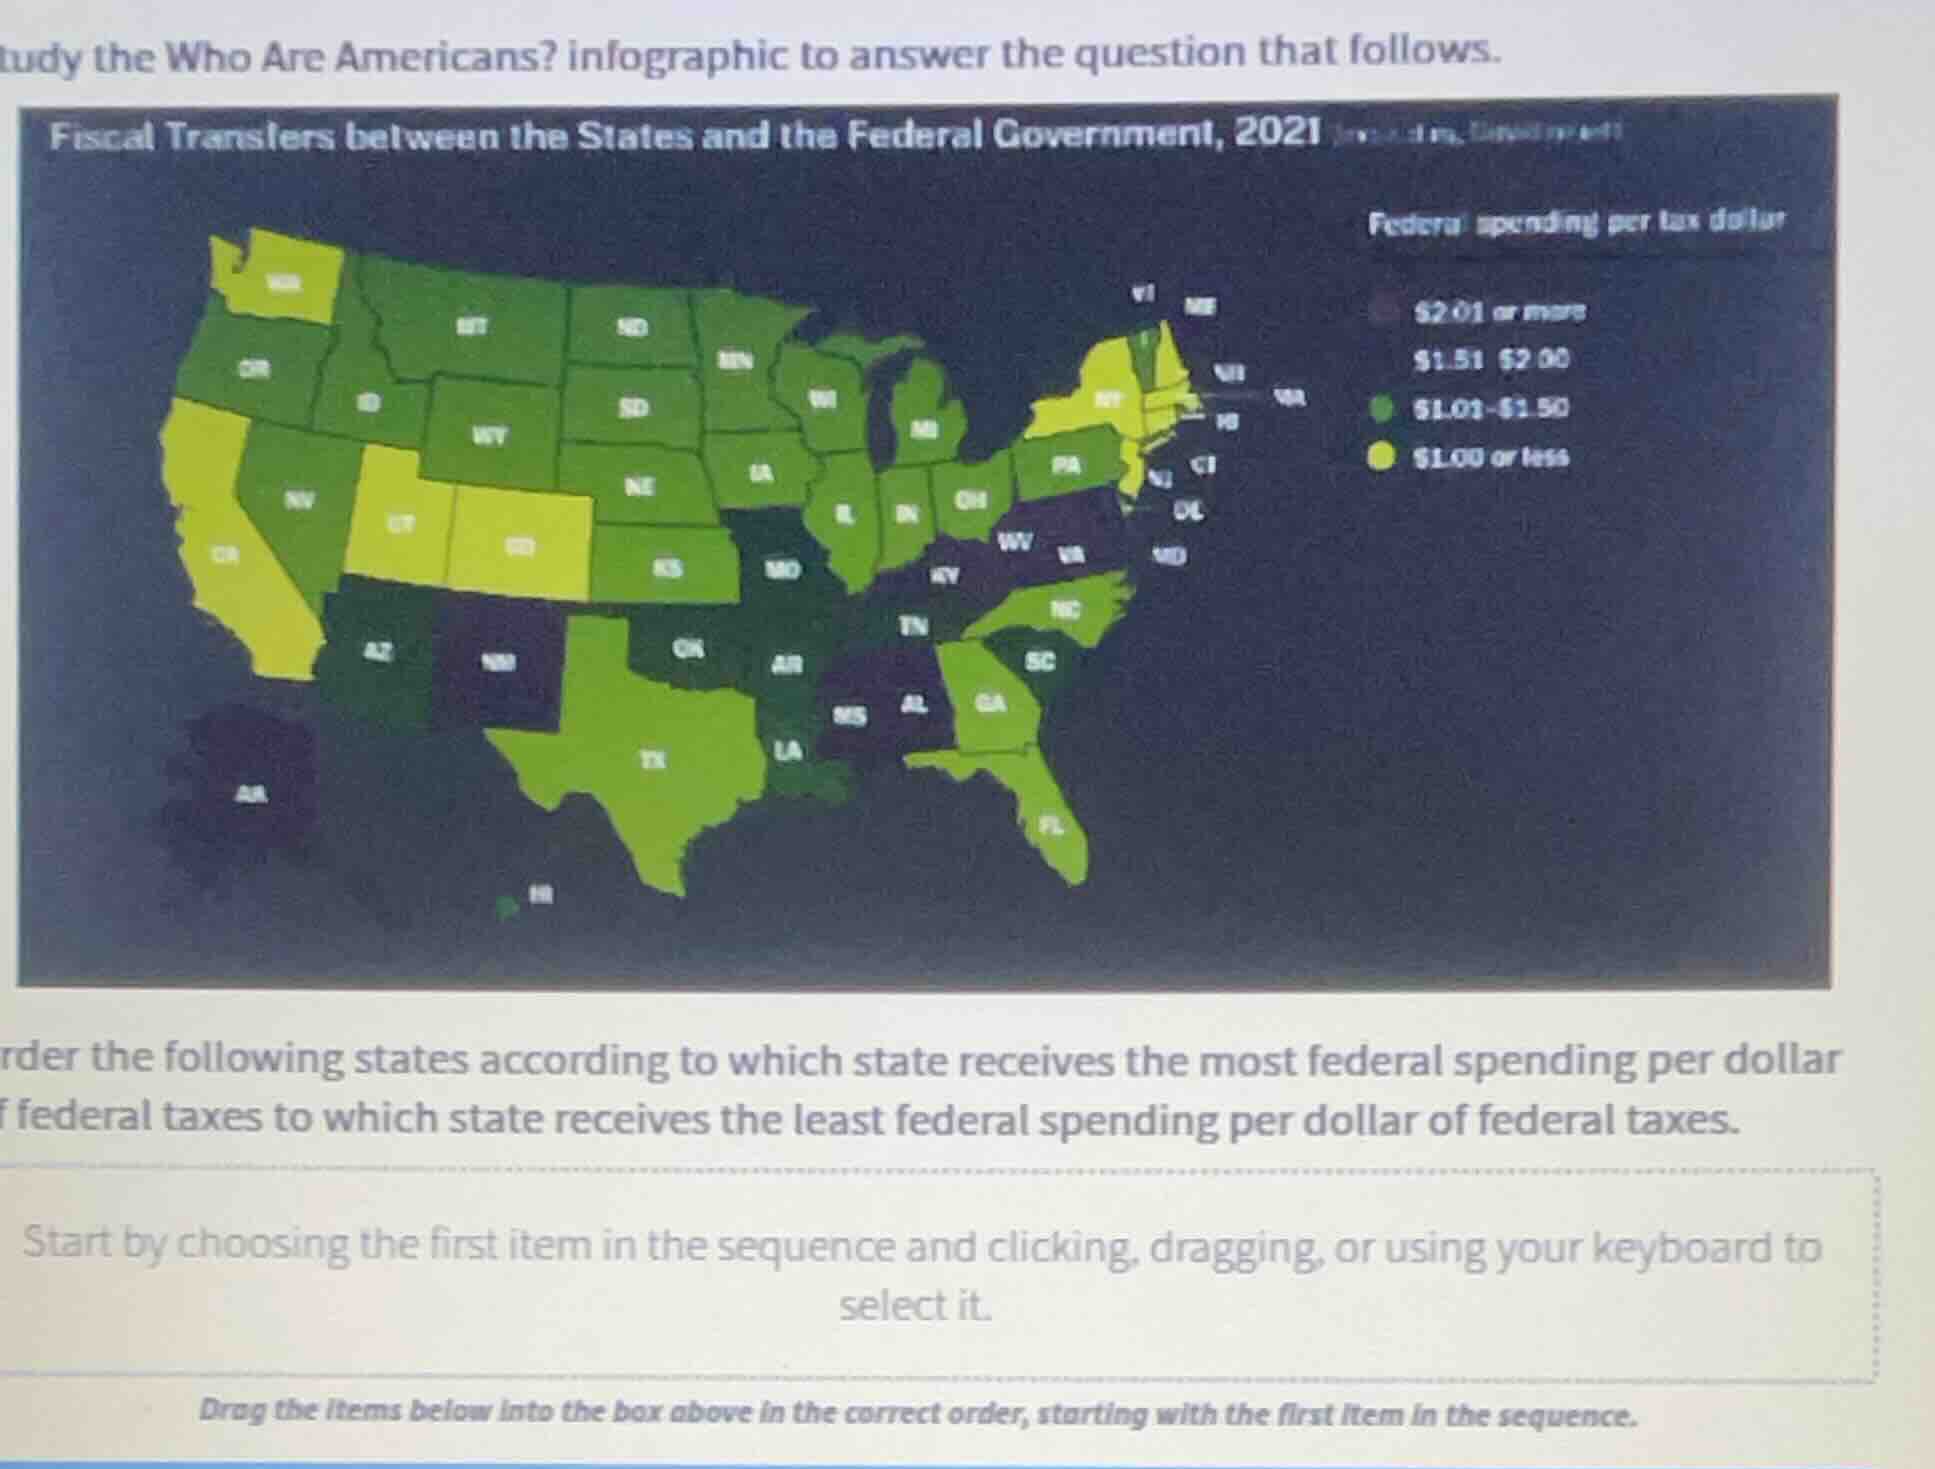
The map shows "Federal spending per tax dollar" in 2021 categorized into four tiers:
- Dark Purple: \$2.01 or more (Most federal spending per dollar)
- Dark Green: \$1.51 – \$2.00
- Light Green: \$1.01 – \$1.50
- Yellow-Green: \$1.00 or less (Least federal spending per dollar)
Identify the states to be ordered
Although the draggable items at the bottom are cut off in the image, standard questions using this specific infographic typically ask to order a representative set of states from different tiers, such as:
- New Mexico (NM) / West Virginia (WV) / Mississippi (MS) / Alabama (AL) / Alaska (AK): Dark Purple (\$2.01 or more)
- Oregon (OR) / Texas (TX) / Florida (FL) / Ohio (OH): Light Green (\$1.01 – \$1.50)
- California (CA) / New York (NY) / Utah (UT) / Colorado (CO): Yellow-Green (\$1.00 or less)
Establish the ordering rule
To order any given subset of states from most federal spending per dollar to least federal spending per dollar, group them by their color-coded values on the map:
- Most spending (\$2.01 or more - Dark Purple): e.g., New Mexico (NM), West Virginia (WV), Mississippi (MS), Alabama (AL), Kentucky (KY), Alaska (AK), Hawaii (HI).
- High-mid spending (\$1.51 – \$2.00 - Dark Green): e.g., Arizona (AZ), Montana (MT), Wyoming (WY), Missouri (MO), Arkansas (AR), Louisiana (LA).
- Low-mid spending (\$1.01 – \$1.50 - Light Green): e.g., Texas (TX), Florida (FL), Oregon (OR), Washington (WA), Idaho (ID), North Dakota (ND), South Dakota (SD), Nebraska (NE), Kansas (KS), Oklahoma (OK), Iowa (IA), Illinois (IL), Indiana (IN), Michigan (MI), Ohio (OH), Pennsylvania (PA), North Carolina (NC), Georgia (GA), Maine (ME).
- Least spending (\$1.00 or less - Yellow-Green): e.g., California (CA), Nevada (NV), Utah (UT), Colorado (CO), Minnesota (MN), Wisconsin (WI), New York (NY), Massachusetts (MA), Connecticut (CT), New Jersey (NJ).

Snap & solve any problem in the app
Get step-by-step solutions on Sovi AI
Photo-based solutions with guided steps
Explore more problems and detailed explanations
To order the states from most federal spending per dollar (highest) to least federal spending per dollar (lowest), arrange them according to their color category on the map:
- First (Most Spending - \$2.01 or more): States in Dark Purple (e.g., New Mexico, West Virginia, Mississippi, Alabama, Kentucky, Alaska, Hawaii).
- Second (\$1.51 – \$2.00): States in Dark Green (e.g., Arizona, Montana, Wyoming, Missouri, Arkansas, Louisiana).
- Third (\$1.01 – \$1.50): States in Light Green (e.g., Texas, Florida, Oregon, Washington, Ohio, Pennsylvania, North Carolina, Georgia).
- Fourth (Least Spending - \$1.00 or less): States in Yellow-Green (e.g., California, Nevada, Utah, Colorado, Minnesota, New York, New Jersey).