QUESTION IMAGE
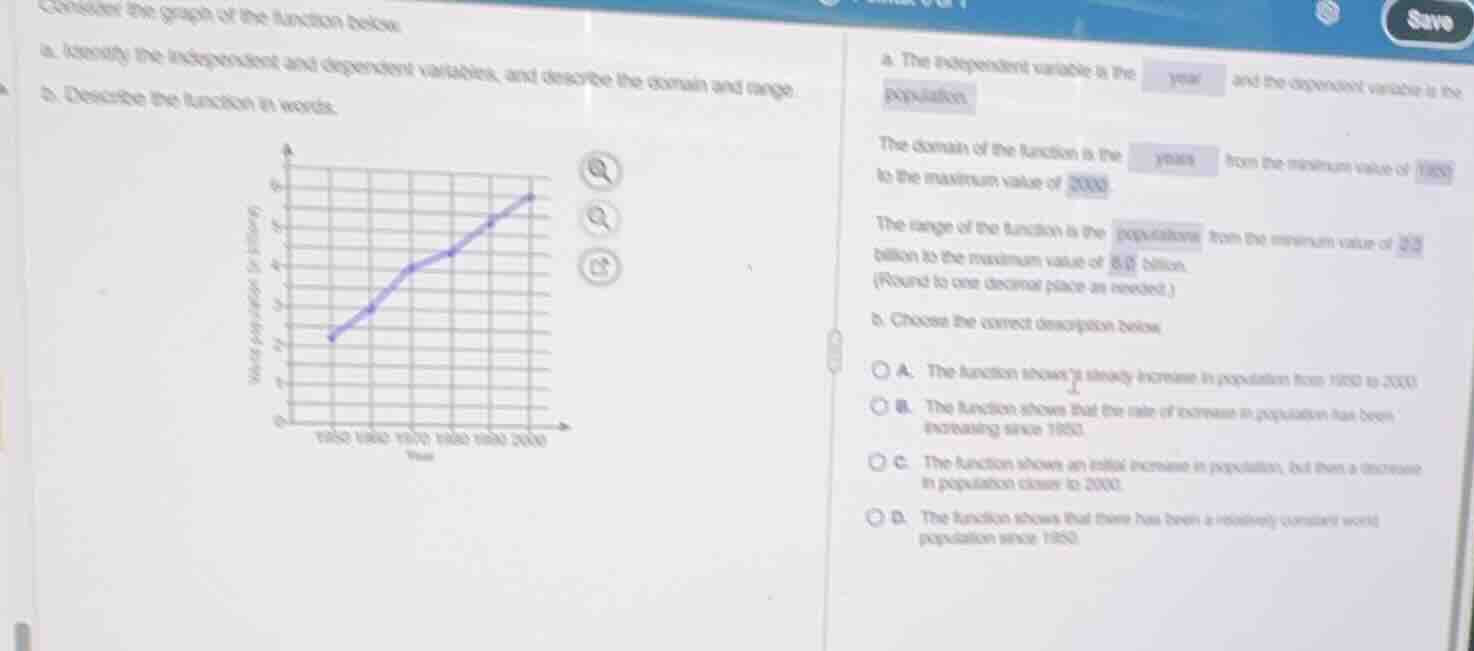
Question
Question was provided via image upload.
Identify variables and domain
Using the Independent and Dependent Variables and Domain and Range knowledge points
Determine the range
Using the Domain and Range and Function Representation knowledge points
Describe the function in words
To describe the function shown on the graph, we analyze the trend of the line from the year 1950 to 2000.
- The line starts at \(2.5\) billion in 1950 and moves upward continuously, reaching \(6.0\) billion in 2000.
- This continuous upward movement represents a steady, overall increase in the world population over this 50-year period.
- Looking at the options:
- A. The function shows a steady increase in population from 1950 to 2000. (This matches the continuous upward trend).
- B. The function shows that the rate of increase in population has been increasing since 1950. (The slope actually changes and flattens slightly in some segments, so the rate of increase is not strictly increasing).
- C. The function shows an initial increase in population, but then a decrease... (There is no decrease; the line never goes down).
- D. The function shows that there has been a relatively constant world population... (The population more than doubles, which is not constant).
Therefore, option A is the correct description.

Snap & solve any problem in the app
Get step-by-step solutions on Sovi AI
Photo-based solutions with guided steps
Explore more problems and detailed explanations
Question 1
a. The independent variable is the year and the dependent variable is the population.
The domain of the function is the years from the minimum value of 1950 to the maximum value of 2000.
The range of the function is the population from the minimum value of 2.5 billion to the maximum value of 6.0 billion.
Question 2
b. Choose the correct description below:
- A. The function shows a steady increase in population from 1950 to 2000. (Correct answer)
- B. The function shows that the rate of increase in population has been increasing since 1950.
- C. The function shows an initial increase in population, but then a decrease in population closer to 2000.
- D. The function shows that there has been a relatively constant world population since 1950.