QUESTION IMAGE
Question
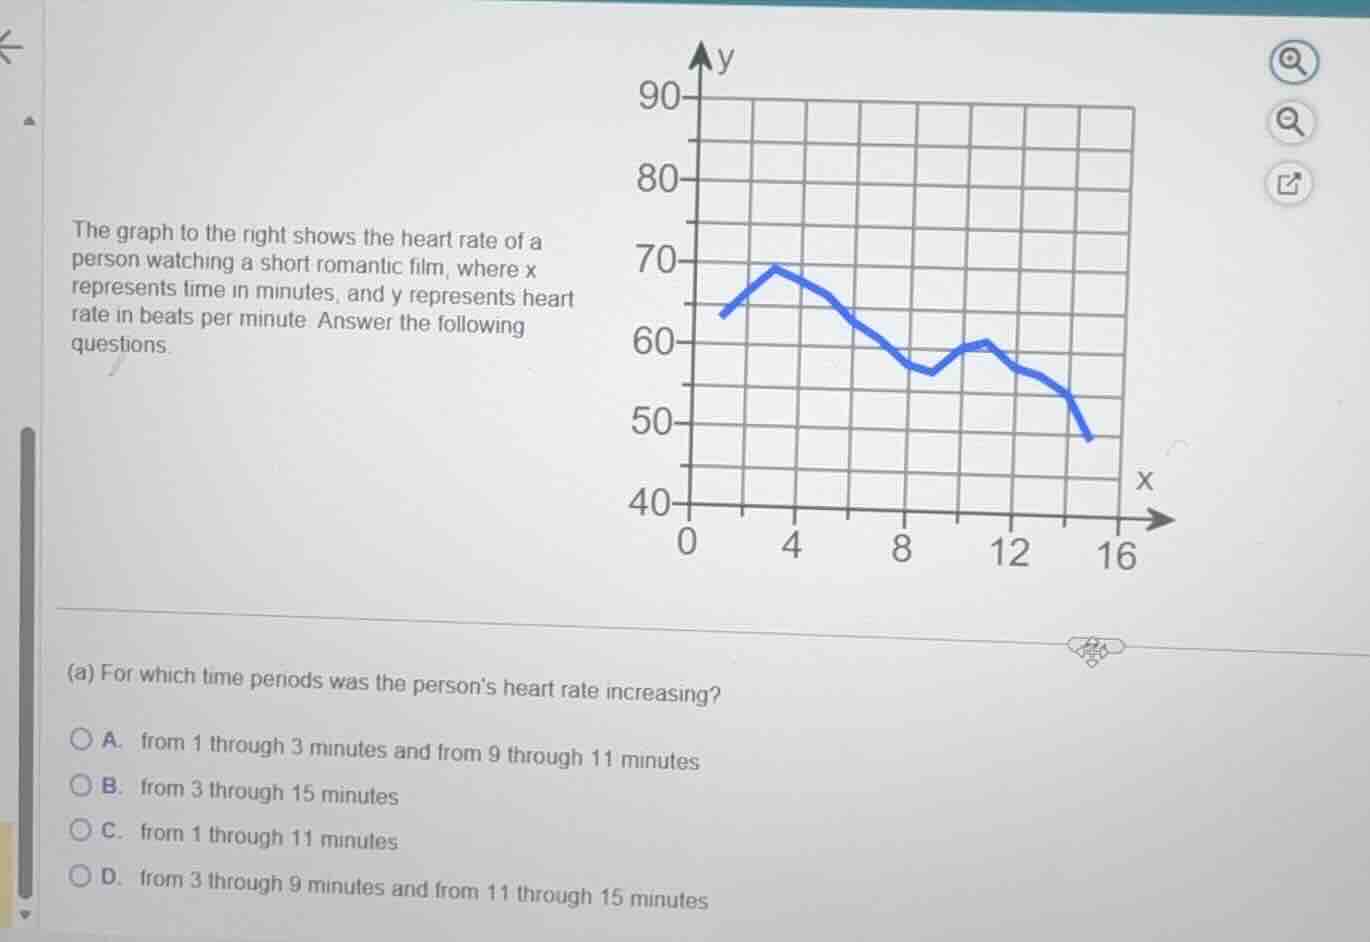
the graph to the right shows the heart rate of a person watching a short romantic film, where x represents time in minutes, and y represents heart rate in beats per minute. answer the following questions.
(a) for which time periods was the persons heart rate increasing?
a. from 1 through 3 minutes and from 9 through 11 minutes
b. from 3 through 15 minutes
c. from 1 through 11 minutes
d. from 3 through 9 minutes and from 11 through 15 minutes
Identify the intervals of increase
To find when the heart rate is increasing, we look for the intervals where the graph rises from left to right.
Analyze the first rising interval
The graph starts at \(x = 1\) with a value of approximately \(64\). It rises steadily until it reaches a peak at \(x = 3\) with a value of approximately \(70\). This represents an increasing interval from \(1\) through \(3\) minutes.
Analyze the falling and rising intervals
From \(x = 3\) to \(x = 9\), the graph generally goes downwards, indicating a decrease in heart rate. At \(x = 9\), the heart rate reaches a local minimum of approximately \(57\). From \(x = 9\), the graph rises again to a local peak at \(x = 11\) with a value of \(60\). This represents another increasing interval from \(9\) through \(11\) minutes.
Analyze the final interval
From \(x = 11\) to the end of the graph at \(x = 15\), the curve goes downwards, meaning the heart rate is decreasing.
Combine the increasing intervals
Combining the two rising sections, the person's heart rate was increasing from \(1\) through \(3\) minutes and from \(9\) through \(11\) minutes. This matches option A.

Snap & solve any problem in the app
Get step-by-step solutions on Sovi AI
Photo-based solutions with guided steps
Explore more problems and detailed explanations
- (A) from 1 through 3 minutes and from 9 through 11 minutes (Correct answer)
- (B) from 3 through 15 minutes
- (C) from 1 through 11 minutes
- (D) from 3 through 9 minutes and from 11 through 15 minutes