QUESTION IMAGE
Question
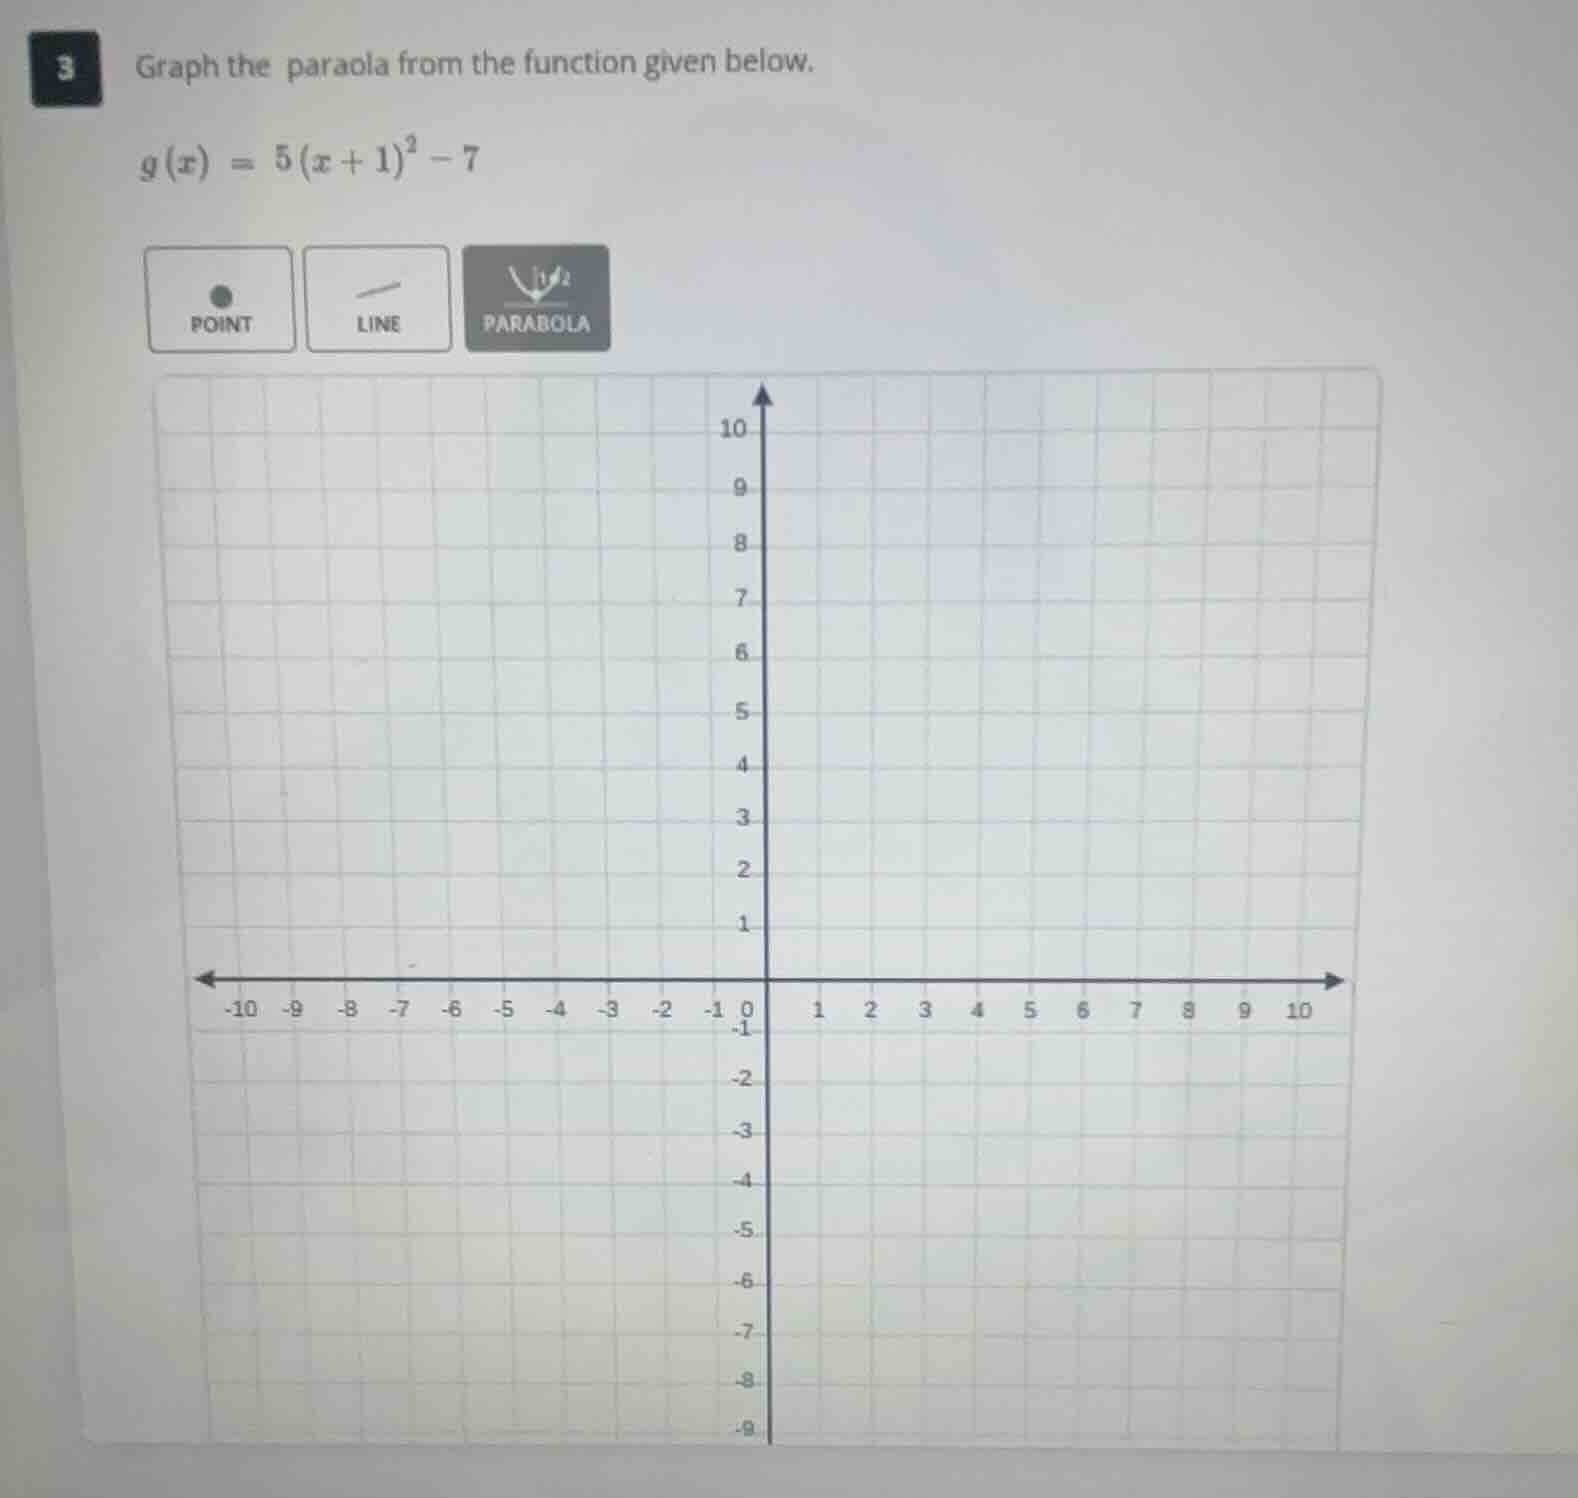
3 graph the parabola from the function given below.
(g(x) = 5(x + 1)^2 - 7)
🆕 New Concept Discovered: Graphing Quadratic Functions in Vertex Form
Finding the turning point and key points of a parabola
Step 1: Identify the vertex
The given quadratic function is in vertex form:
\[ g(x) = a(x - h)^2 + k \]
Comparing this to our function:
\[ g(x) = 5(x + 1)^2 - 7 \]
We can rewrite \( (x + 1) \) as \( (x - (-1)) \):
- \( h = -1 \)
- \( k = -7 \)
The vertex \( (h, k) \) is the lowest point (turning point) of the parabola:
\[ \text{Vertex} = (-1, -7) \]
Step 2: Find additional points
To graph the parabola accurately, we calculate the function values for \( x \)-values near the vertex.
For \( x = 0 \):
\[ g(0) = 5(0 + 1)^2 - 7 = 5(1)^2 - 7 = 5 - 7 = -2 \]
This gives the point \( (0, -2) \).
For \( x = -2 \) (by symmetry about the axis of symmetry \( x = -1 \)):
\[ g(-2) = 5(-2 + 1)^2 - 7 = 5(-1)^2 - 7 = 5 - 7 = -2 \]
This gives the point \( (-2, -2) \).
Step 3: Plot the points and draw the parabola
- Select the PARABOLA tool.
- Click on the vertex at \( (-1, -7) \).
- Click on one of the other calculated points, such as \( (0, -2) \) or \( (-2, -2) \), to define the width and direction of the parabola.

Snap & solve any problem in the app
Get step-by-step solutions on Sovi AI
Photo-based solutions with guided steps
Explore more problems and detailed explanations
To graph the function \( g(x) = 5(x + 1)^2 - 7 \):
- Plot the vertex at \( (-1, -7) \).
- Plot a second point at \( (0, -2) \) (or \( (-2, -2) \)).
- Draw the upward-opening parabola passing through these points.