QUESTION IMAGE
Question
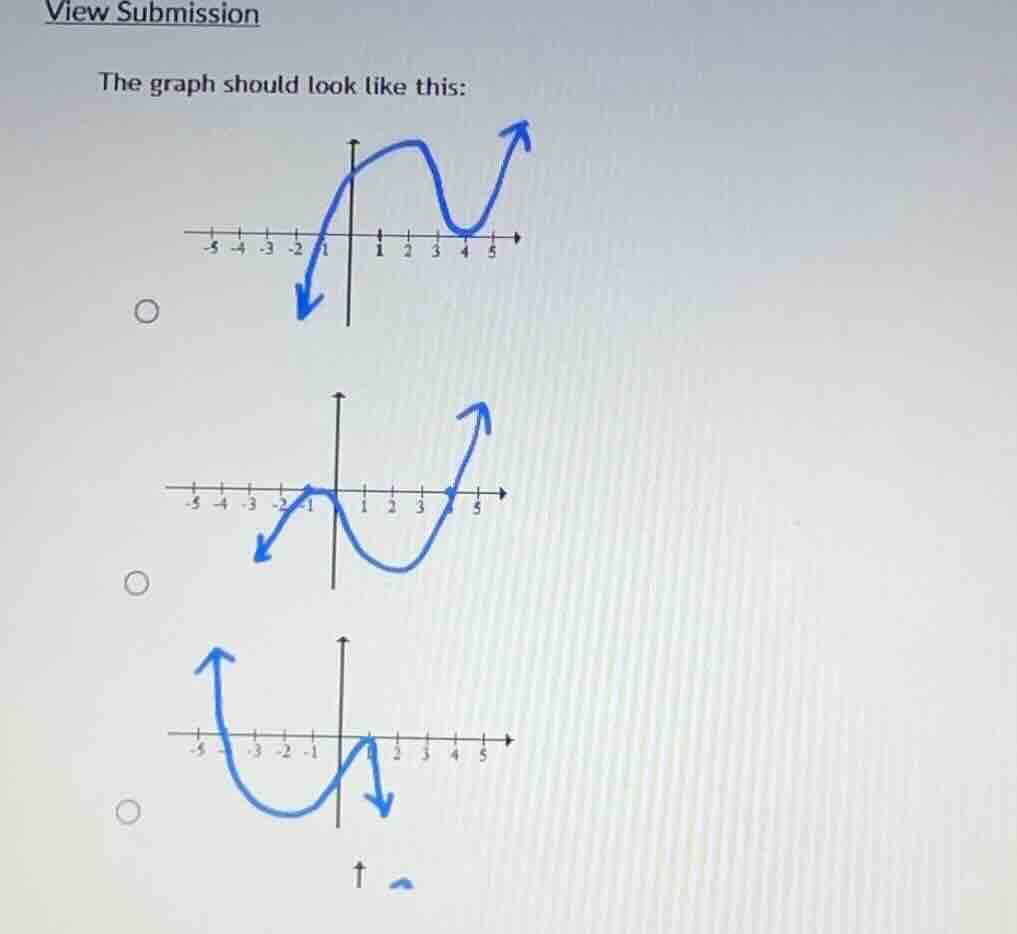
the graph should look like this:
Step1: Identify the x-intercepts
The middle graph crosses the x-axis at \(x = -1\), \(x = 1\), and \(x = 4\).
Step2: Analyze the end behavior
The graph starts in the third quadrant and ends in the first quadrant, indicating a positive cubic function.

Snap & solve any problem in the app
Get step-by-step solutions on Sovi AI
Photo-based solutions with guided steps
Explore more problems and detailed explanations
The second option (the middle graph).