QUESTION IMAGE
Question
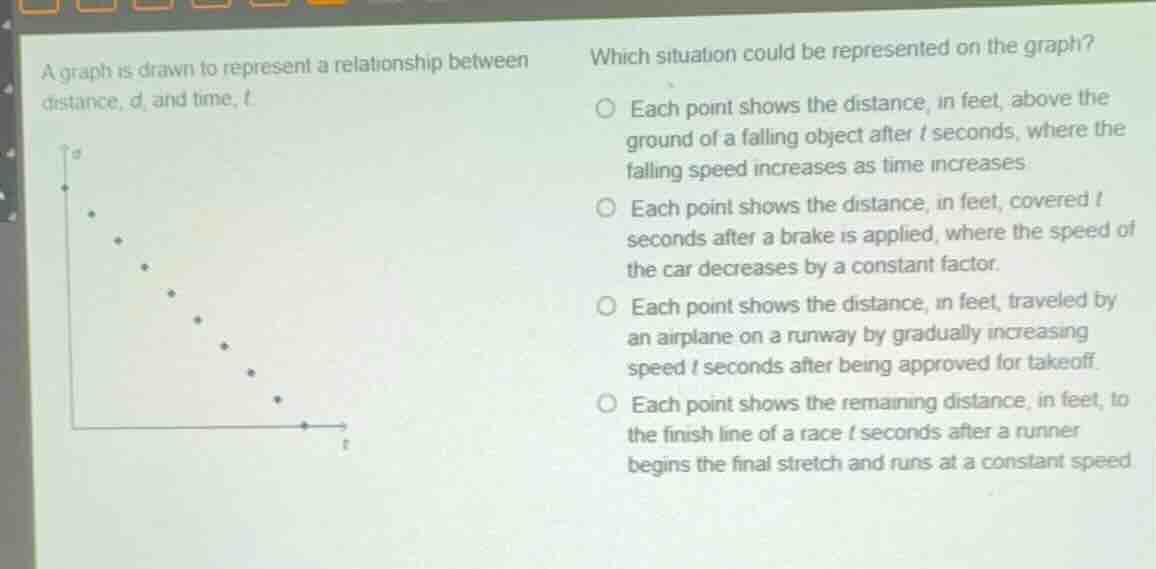
a graph is drawn to represent a relationship between distance, \\(d\\), and time, \\(t\\).
which situation could be represented on the graph?
each point shows the distance, in feet, above the ground of a falling object after \\(t\\) seconds, where the falling speed increases as time increases.
each point shows the distance, in feet, covered \\(t\\) seconds after a brake is applied, where the speed of the car decreases by a constant factor.
each point shows the distance, in feet, traveled by an airplane on a runway by gradually increasing speed \\(t\\) seconds after being approved for takeoff.
each point shows the remaining distance, in feet, to the finish line of a race \\(t\\) seconds after a runner begins the final stretch and runs at a constant speed.
Analyze the graph's key features
The graph shows a set of discrete points representing a relationship between distance \(d\) (on the vertical axis) and time \(t\) (on the horizontal axis).
- As time \(t\) increases, the distance \(d\) decreases.
- The points lie along a straight line, which indicates a constant rate of change (linear relationship).
Evaluate the first option
- Option 1: "Each point shows the distance, in feet, above the ground of a falling object after \(t\) seconds, where the falling speed increases as time increases."
- Analysis: If speed increases over time, the distance above the ground would decrease at an accelerating rate, resulting in a curved path (quadratic decay), not a straight line. Thus, this option is incorrect.
Evaluate the second option
- Option 2: "Each point shows the distance, in feet, covered \(t\) seconds after a brake is applied, where the speed of the car decreases by a constant factor."
- Analysis: First, the distance covered after braking should increase over time, not decrease. Second, a speed decreasing by a constant factor suggests exponential decay, which is non-linear. Thus, this option is incorrect.
Evaluate the third option
- Option 3: "Each point shows the distance, in feet, traveled by an airplane on a runway by gradually increasing speed \(t\) seconds after being approved for takeoff."
- Analysis: The distance traveled from takeoff would start at zero and increase over time. Since speed is increasing, the graph would curve upwards. Thus, this option is incorrect.
Evaluate the fourth option
- Option 4: "Each point shows the remaining distance, in feet, to the finish line of a race \(t\) seconds after a runner begins the final stretch and runs at a constant speed."
- Analysis:
- As time \(t\) increases, the remaining distance to the finish line decreases, which matches the downward trend of the points.
- Since the runner runs at a constant speed, the rate of decrease in remaining distance is constant. This matches the linear, straight-line pattern of the points on the graph.
- Therefore, this situation is perfectly represented by the graph. We apply Graph Interpretation to confirm this is the correct choice.

Snap & solve any problem in the app
Get step-by-step solutions on Sovi AI
Photo-based solutions with guided steps
Explore more problems and detailed explanations
- (A) Each point shows the distance, in feet, above the ground of a falling object after \(t\) seconds, where the falling speed increases as time increases.
- (B) Each point shows the distance, in feet, covered \(t\) seconds after a brake is applied, where the speed of the car decreases by a constant factor.
- (C) Each point shows the distance, in feet, traveled by an airplane on a runway by gradually increasing speed \(t\) seconds after being approved for takeoff.
- (D) Each point shows the remaining distance, in feet, to the finish line of a race \(t\) seconds after a runner begins the final stretch and runs at a constant speed. (Correct answer)