QUESTION IMAGE
Question
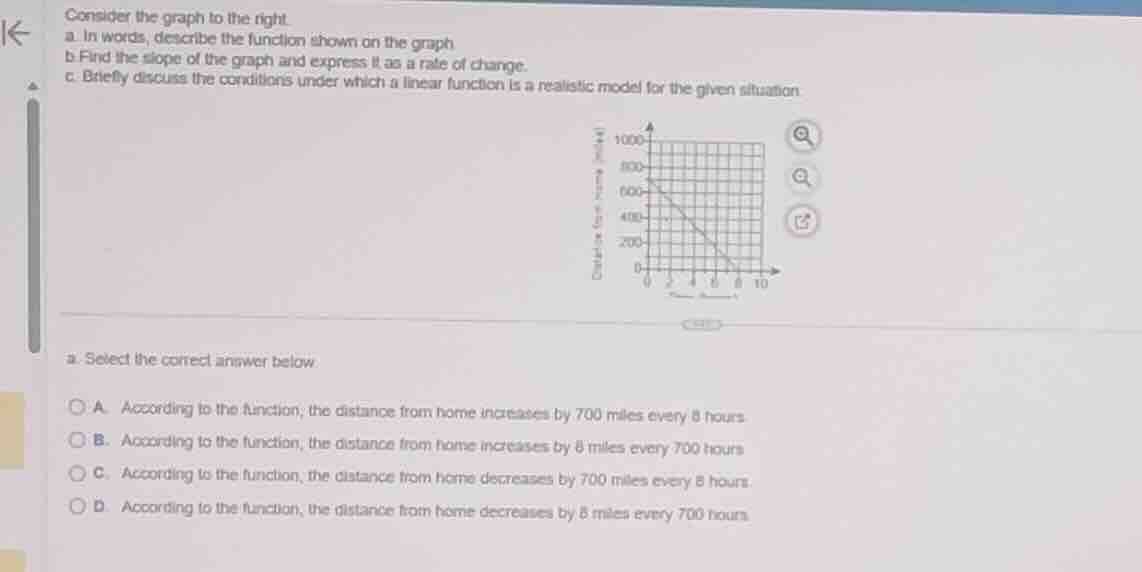
consider the graph to the right.
a. in words, describe the function shown on the graph
b. find the slope of the graph and express it as a rate of change.
c. briefly discuss the conditions under which a linear function is a realistic model for the given situation.
a. select the correct answer below
a. according to the function, the distance from home increases by 700 miles every 8 hours.
b. according to the function, the distance from home increases by 8 miles every 700 hours.
c. according to the function, the distance from home decreases by 700 miles every 8 hours.
d. according to the function, the distance from home decreases by 8 miles every 700 hours.
Analyze the graph axes and initial values
Using the Graph Interpretation knowledge point
Determine the behavior of the function
Using the Linear Growth knowledge point
Match with the multiple-choice options
We evaluate the given options based on our findings:
- Option A states the distance increases by 700 miles every 8 hours (incorrect, it decreases).
- Option B states the distance increases by 8 miles every 700 hours (incorrect).
- Option C states the distance decreases by 700 miles every 8 hours (correct, as the distance goes from 700 to 0 over 8 hours).
- Option D states the distance decreases by 8 miles every 700 hours (incorrect).

Snap & solve any problem in the app
Get step-by-step solutions on Sovi AI
Photo-based solutions with guided steps
Explore more problems and detailed explanations
- (A) According to the function, the distance from home increases by 700 miles every 8 hours.
- (B) According to the function, the distance from home increases by 8 miles every 700 hours.
- (C) According to the function, the distance from home decreases by 700 miles every 8 hours. (Correct answer)
- (D) According to the function, the distance from home decreases by 8 miles every 700 hours.