QUESTION IMAGE
Question
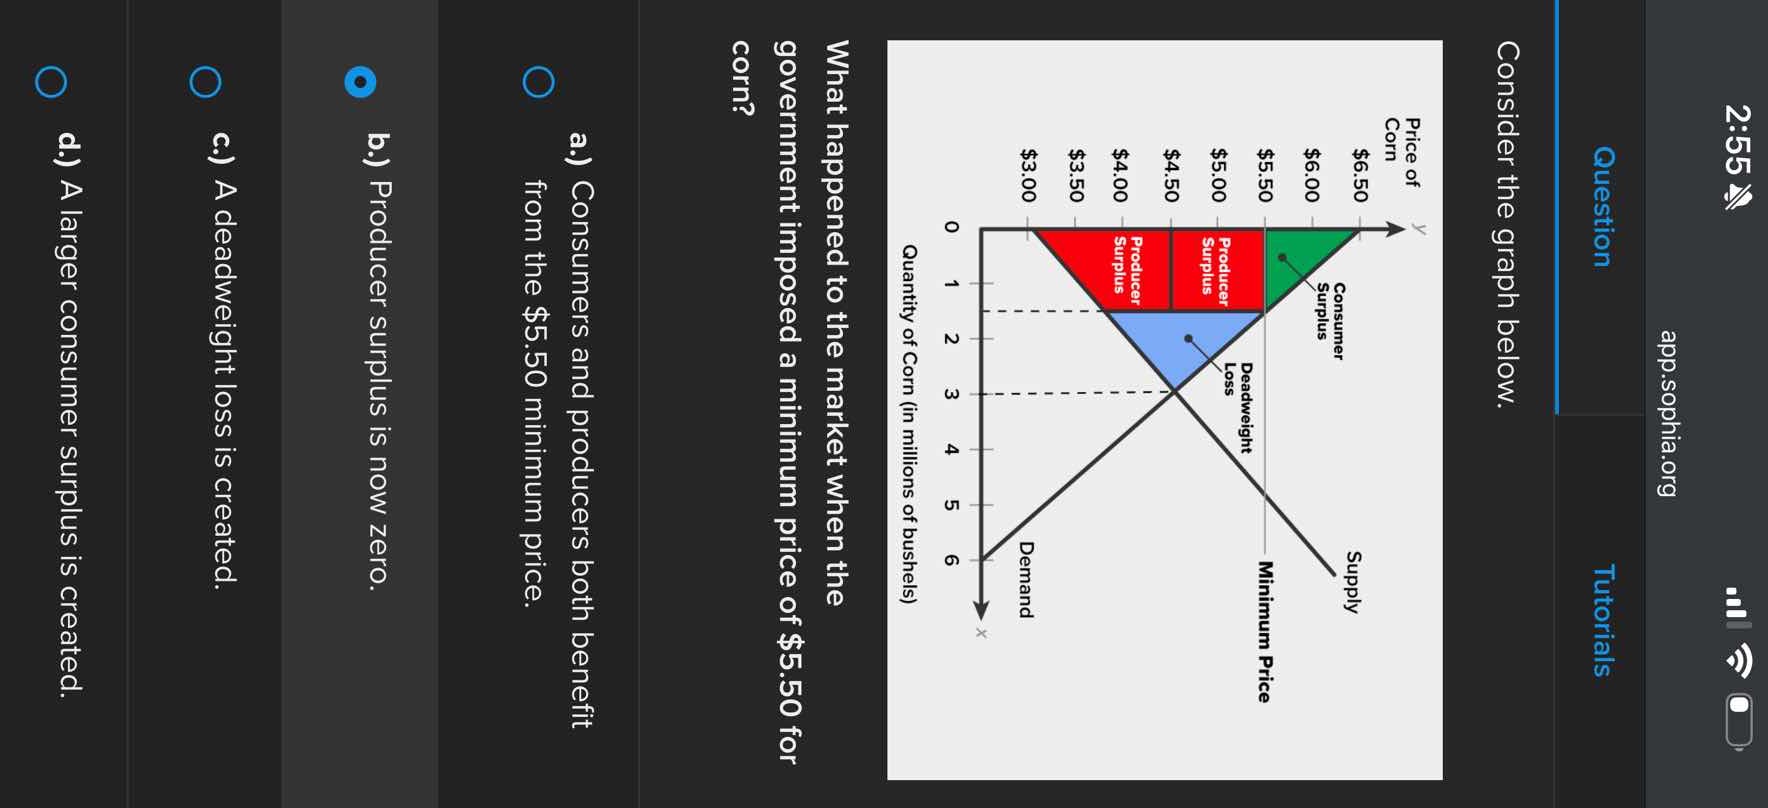
consider the graph below.
what happened to the market when the government imposed a minimum price of \\$5.50 for corn?
a.) consumers and producers both benefit from the \\$5.50 minimum price.
b.) producer surplus is now zero.
c.) a deadweight loss is created.
d.) a larger consumer surplus is created.
🆕 New Concept Discovered: Price Floors and Market Welfare
How government-mandated minimum prices create market inefficiencies.
Step 1: Analyze the Market Equilibrium
Before any government intervention, the market equilibrium is determined by the intersection of the Demand and Supply curves:
- The equilibrium price is \( \$4.50 \).
- The equilibrium quantity is \( 3 \) million bushels.
At this equilibrium, total economic surplus (the sum of consumer surplus and producer surplus) is maximized, and there is no deadweight loss.
Step 2: Analyze the Impact of the Minimum Price
The government imposes a minimum price (price floor) of \( \$5.50 \):
- Because this minimum price is set above the equilibrium price of \( \$4.50 \), it is a binding price floor.
- At \( \$5.50 \), consumers are only willing to buy \( 1.5 \) million bushels (the quantity demanded), while producers want to supply more.
- Because transactions must be mutually agreed upon, the actual quantity traded in the market falls from \( 3 \) million bushels to \( 1.5 \) million bushels.
Step 3: Identify the Resulting Welfare Changes
Because the quantity traded decreases from the socially optimal level of \( 3 \) million bushels to \( 1.5 \) million bushels:
- Some mutually beneficial transactions that would have occurred between \( \$4.50 \) and \( \$5.50 \) are prevented.
- This reduction in transactions creates a loss in total economic surplus that is not captured by anyone.
- This lost economic efficiency is represented by the shaded triangular area labeled Deadweight Loss on the graph.
Let's evaluate the given options:
- a.) Consumers and producers both benefit...: Incorrect. Consumers are worse off because they pay a higher price and consume less.
- b.) Producer surplus is now zero: Incorrect. The graph shows a red shaded region representing a positive producer surplus.
- c.) A deadweight loss is created: Correct. The restriction in quantity traded directly generates a deadweight loss.
- d.) A larger consumer surplus is created: Incorrect. Consumer surplus shrinks to the small green triangle because consumers pay a higher price for fewer goods.

Snap & solve any problem in the app
Get step-by-step solutions on Sovi AI
Photo-based solutions with guided steps
Explore more problems and detailed explanations
c.) A deadweight loss is created.