QUESTION IMAGE
Question
analyzing projectile motion
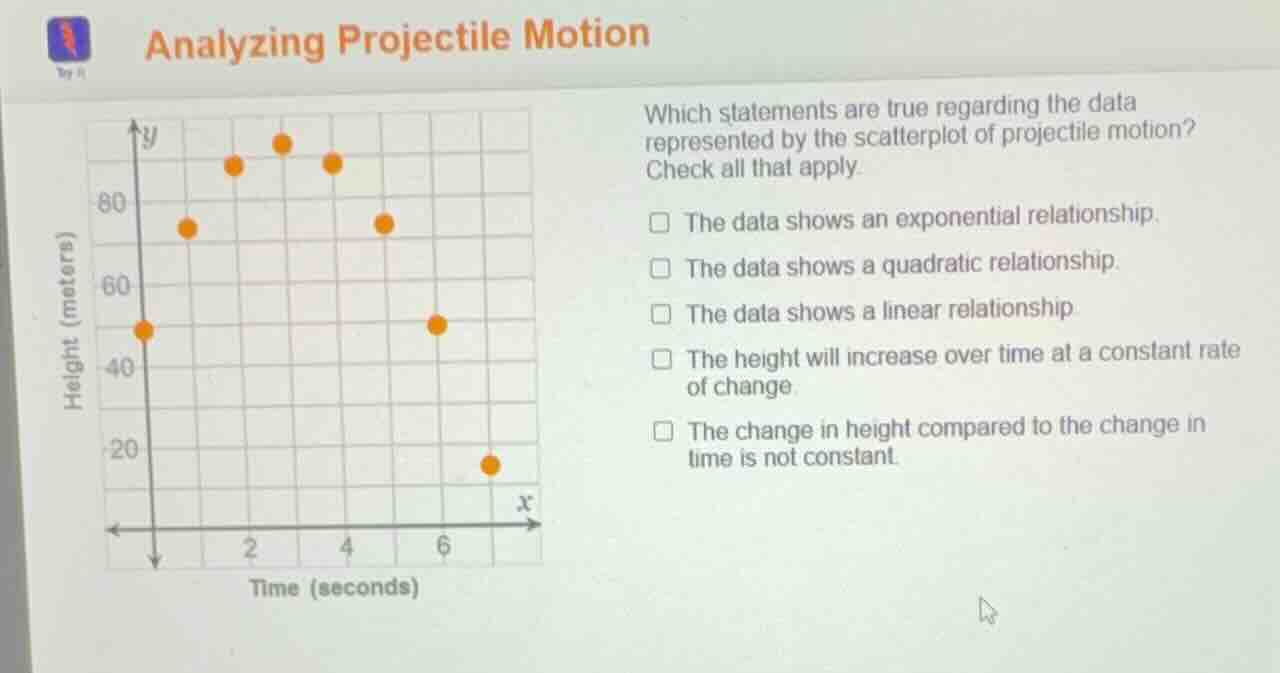
which statements are true regarding the data represented by the scatterplot of projectile motion?
check all that apply.
- the data shows an exponential relationship.
- the data shows a quadratic relationship.
- the data shows a linear relationship.
- the height will increase over time at a constant rate of change.
- the change in height compared to the change in time is not constant.
Analyze the shape of the scatterplot
Using the Quadratic Modeling Interpretation knowledge point
The scatterplot displays data points that rise to a peak (vertex) near \(t = 3\) seconds and then fall symmetrically. This parabolic curve shape represents a quadratic relationship, which is standard for projectile motion under gravity.
Evaluate the rate of change
Using the Rate of Change Interpretation knowledge point
Because the relationship is quadratic and curved rather than a straight line, the rate of change (slope) is not constant. The height increases rapidly at first, slows down near the peak, and then decreases at an increasing rate.
Determine the correct statements
- "The data shows an exponential relationship." (False)
- "The data shows a quadratic relationship." (True)
- "The data shows a linear relationship." (False)
- "The height will increase over time at a constant rate of change." (False)
- "The change in height compared to the change in time is not constant." (True)

Snap & solve any problem in the app
Get step-by-step solutions on Sovi AI
Photo-based solutions with guided steps
Explore more problems and detailed explanations
- The data shows an exponential relationship.
- The data shows a quadratic relationship. (Correct answer)
- The data shows a linear relationship.
- The height will increase over time at a constant rate of change.
- The change in height compared to the change in time is not constant. (Correct answer)