QUESTION IMAGE
Question
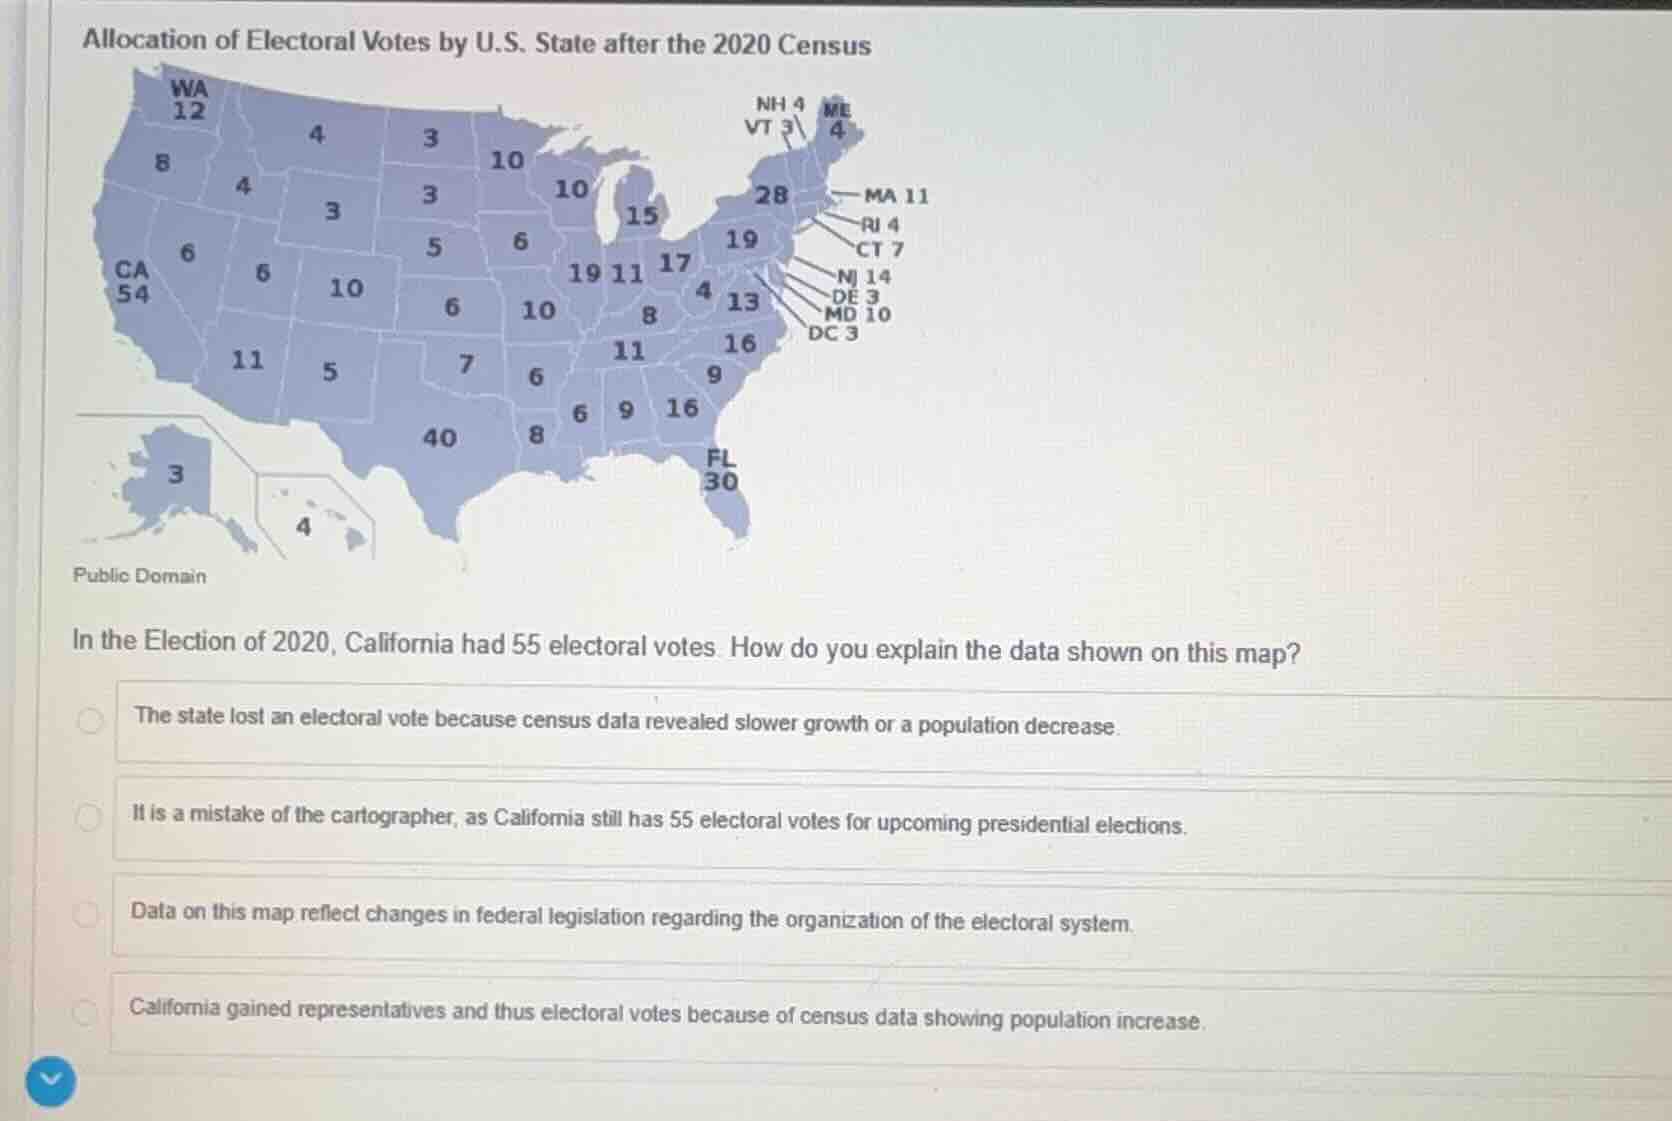
allocation of electoral votes by u.s. state after the 2020 census
in the election of 2020, california had 55 electoral votes. how do you explain the data shown on this map?
- the state lost an electoral vote because census data revealed slower growth or a population decrease.
- it is a mistake of the cartographer, as california still has 55 electoral votes for upcoming presidential elections.
- data on this map reflect changes in federal legislation regarding the organization of the electoral system.
- california gained representatives and thus electoral votes because of census data showing population increase.
Analyze the map data
Using the Electoral College and Electoral Votes knowledge points, we observe that the map displays the allocation of electoral votes by state after the 2020 Census, showing California (CA) with 54 electoral votes.
Compare with the prompt premise
The prompt states that in the Election of 2020, California had 55 electoral votes, but the post-2020 Census map shows California with 54 electoral votes, indicating a loss of one electoral vote.
Apply apportionment principles
Using the U.S. Census and Apportionment knowledge points:
A state loses a congressional seat (and thus an electoral vote) when its population grows more slowly than other states or decreases relative to the national average.
Evaluate the given options
- Option 1 correctly explains that the state lost an electoral vote due to census data showing slower relative population growth.
- Option 2 is incorrect because the change is a result of official reapportionment, not a cartographer's mistake.
- Option 3 is incorrect because the change is driven by constitutional apportionment based on population shifts, not new federal legislation reorganizing the system.
- Option 4 is incorrect because California lost an electoral vote (from 55 to 54), rather than gaining one.

Snap & solve any problem in the app
Get step-by-step solutions on Sovi AI
Photo-based solutions with guided steps
Explore more problems and detailed explanations
- (A) The state lost an electoral vote because census data revealed slower growth or a population decrease. (Correct answer)
- (B) It is a mistake of the cartographer, as California still has 55 electoral votes for upcoming presidential elections.
- (C) Data on this map reflect changes in federal legislation regarding the organization of the electoral system.
- (D) California gained representatives and thus electoral votes because of census data showing population increase.