QUESTION IMAGE
Question
according to the graph,
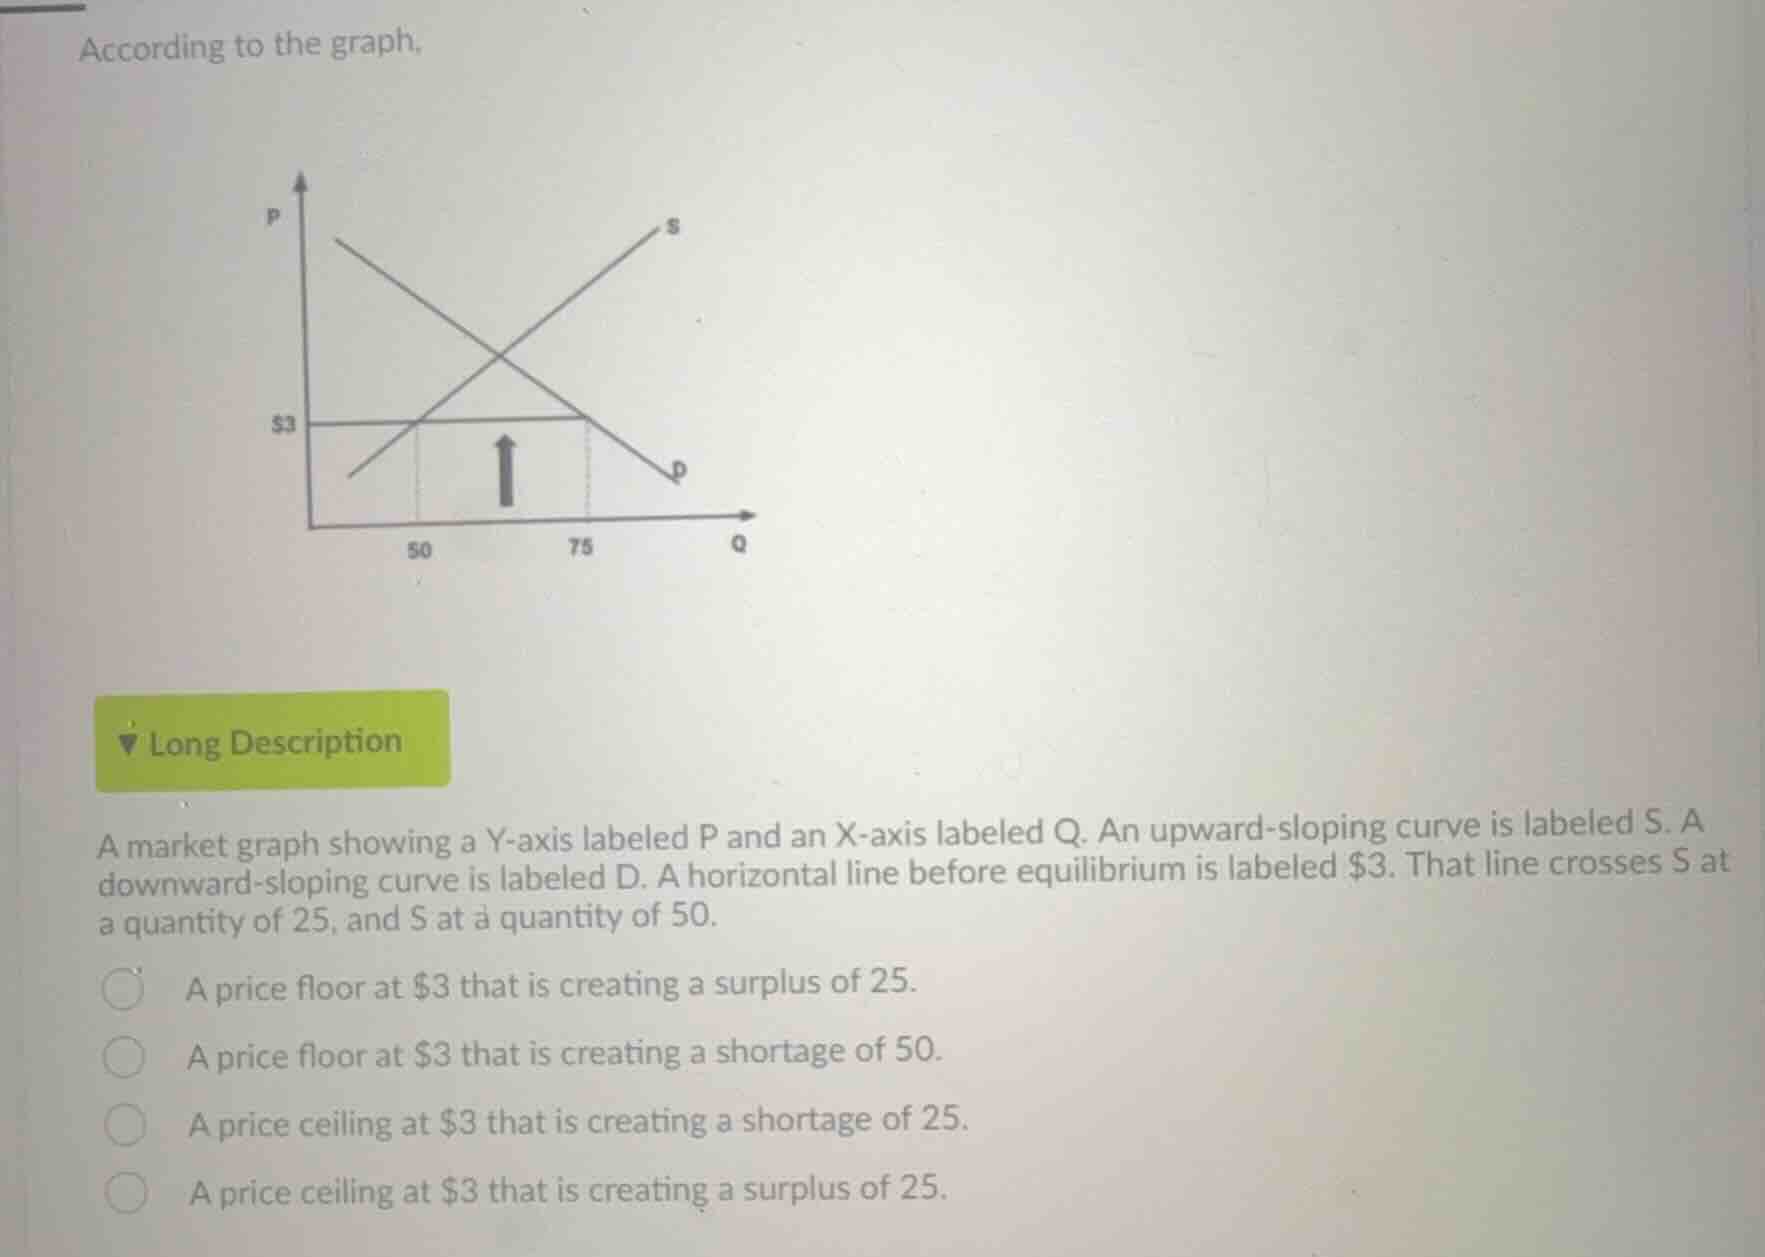
a market graph showing a y-axis labeled p and an x-axis labeled q. an upward-sloping curve is labeled s. a downward-sloping curve is labeled d. a horizontal line before equilibrium is labeled $3. that line crosses s at a quantity of 25, and s at a quantity of 50.
- a price floor at $3 that is creating a surplus of 25.
- a price floor at $3 that is creating a shortage of 50.
- a price ceiling at $3 that is creating a shortage of 25.
- a price ceiling at $3 that is creating a surplus of 25.
Identify the market equilibrium
The graph shows a standard supply and demand diagram. The upward-sloping supply curve is labeled \(S\) and the downward-sloping demand curve is labeled \(D\). Their intersection represents the Market Equilibrium. Looking at the graph, the equilibrium price is clearly above the horizontal line labeled \(\$3\).
Analyze the price control at \$3
A horizontal line is set at \(\$3\), which is below the equilibrium price. Because this price control is set below the equilibrium price and prevents the price from rising to its natural equilibrium, it acts as a maximum legal price, which is a Price Ceiling.
Determine quantity demanded and supplied
Using the Market Equilibrium framework, we look at where the price of \(\$3\) intersects the curves:
- The horizontal line at \(\$3\) intersects the supply curve \(S\) at a quantity of \(50\) (as labeled on the horizontal axis). This is the quantity supplied (\(Q_s = 50\)).
- The horizontal line at \(\$3\) intersects the demand curve \(D\) at a quantity of \(75\) (as labeled on the horizontal axis). This is the quantity demanded (\(Q_d = 75\)).
Calculate the shortage or surplus
Using the Surplus and Shortage concept:
- Since the quantity demanded (\(Q_d = 75\)) is greater than the quantity supplied (\(Q_s = 50\)), there is excess demand.
- This excess demand is a shortage.
- \(\text{Shortage} = Q_d - Q_s = 75 - 50 = 25\).
Match with the correct option
A price control set below equilibrium is a price ceiling. At \(\$3\), it creates a shortage of \(25\) units because consumers want to buy \(75\) units but producers only supply \(50\) units. This matches the third option.

Snap & solve any problem in the app
Get step-by-step solutions on Sovi AI
Photo-based solutions with guided steps
Explore more problems and detailed explanations
- A price floor at \$3 that is creating a surplus of 25.
- A price floor at \$3 that is creating a shortage of 50.
- A price ceiling at \$3 that is creating a shortage of 25. (Correct answer)
- A price ceiling at \$3 that is creating a surplus of 25.