QUESTION IMAGE
Question
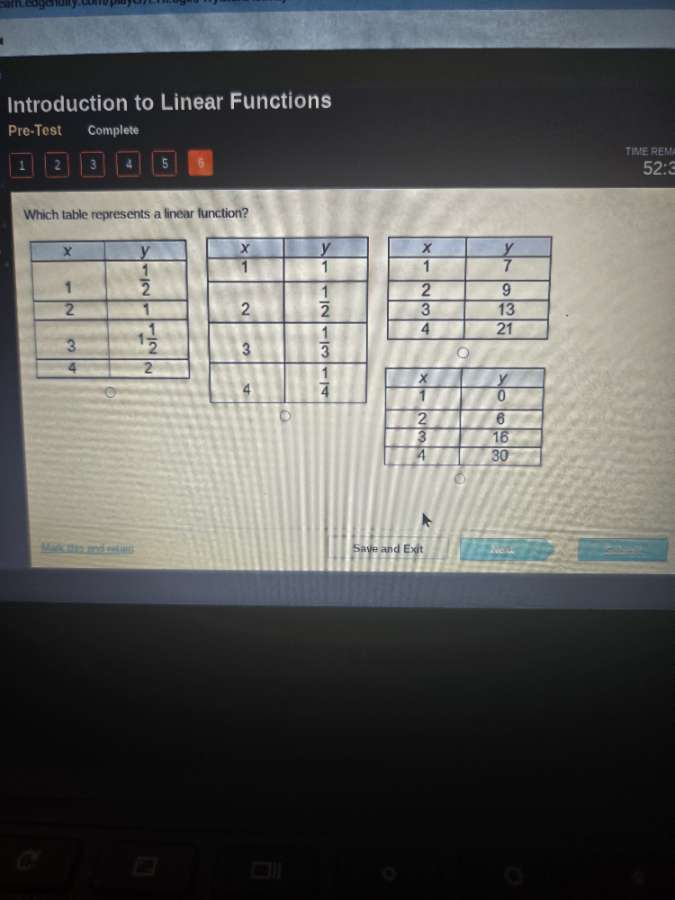
which table represents a linear function?
table 1:
\
$$\begin{array}{|c|c|}
\\hline
x & y \\\\
\\hline
1 & \\frac{1}{2} \\\\
\\hline
2 & 1 \\\\
\\hline
3 & 1\\frac{1}{2} \\\\
\\hline
4 & 2 \\\\
\\hline
\\end{array}$$
table 2:
\
$$\begin{array}{|c|c|}
\\hline
x & y \\\\
\\hline
1 & 1 \\\\
\\hline
2 & \\frac{1}{2} \\\\
\\hline
3 & \\frac{1}{3} \\\\
\\hline
4 & \\frac{1}{4} \\\\
\\hline
\\end{array}$$
table 3:
\
$$\begin{array}{|c|c|}
\\hline
x & y \\\\
\\hline
1 & 7 \\\\
\\hline
2 & 9 \\\\
\\hline
3 & 13 \\\\
\\hline
4 & 21 \\\\
\\hline
\\end{array}$$
table 4:
\
$$\begin{array}{|c|c|}
\\hline
x & y \\\\
\\hline
1 & 0 \\\\
\\hline
2 & 6 \\\\
\\hline
3 & 16 \\\\
\\hline
4 & 30 \\\\
\\hline
\\end{array}$$
⚡ Using what you learned: understanding linear functions
Step 1: Analyze the definition of a linear function
A table represents a linear function if the rate of change (the change in \(y\) divided by the change in \(x\)) is constant. Since the \(x\)-values in all tables increase by a constant step of \(1\), we only need to find the table where the difference between consecutive \(y\)-values is constant:
$$
\Delta y = y_{n+1} - y_n = \text{constant}
$$
Step 2: Test the first table
Check the differences between consecutive \(y\)-values:
- From \(y = \frac{1}{2}\) to \(y = 1\):
$$
1 - \frac{1}{2} = \frac{1}{2}
$$
- From \(y = 1\) to \(y = 1\frac{1}{2}\):
$$
1\frac{1}{2} - 1 = \frac{1}{2}
$$
- From \(y = 1\frac{1}{2}\) to \(y = 2\):
$$
2 - 1\frac{1}{2} = \frac{1}{2}
$$
The difference is constantly \(\frac{1}{2}\).
Step 3: Verify other tables
- Second table: Differences are \(\frac{1}{2} - 1 = -\frac{1}{2}\), then \(\frac{1}{3} - \frac{1}{2} = -\frac{1}{6}\) (not constant).
- Third table: Differences are \(9 - 7 = 2\), then \(13 - 9 = 4\) (not constant).
- Fourth table: Differences are \(6 - 0 = 6\), then \(16 - 6 = 10\) (not constant).

Snap & solve any problem in the app
Get step-by-step solutions on Sovi AI
Photo-based solutions with guided steps
Explore more problems and detailed explanations
The first table represents a linear function:
| x | y |
|---|---|
| 2 | 1 |
| 3 | \(1\frac{1}{2}\) |
| 4 | 2 |