QUESTION IMAGE
Question
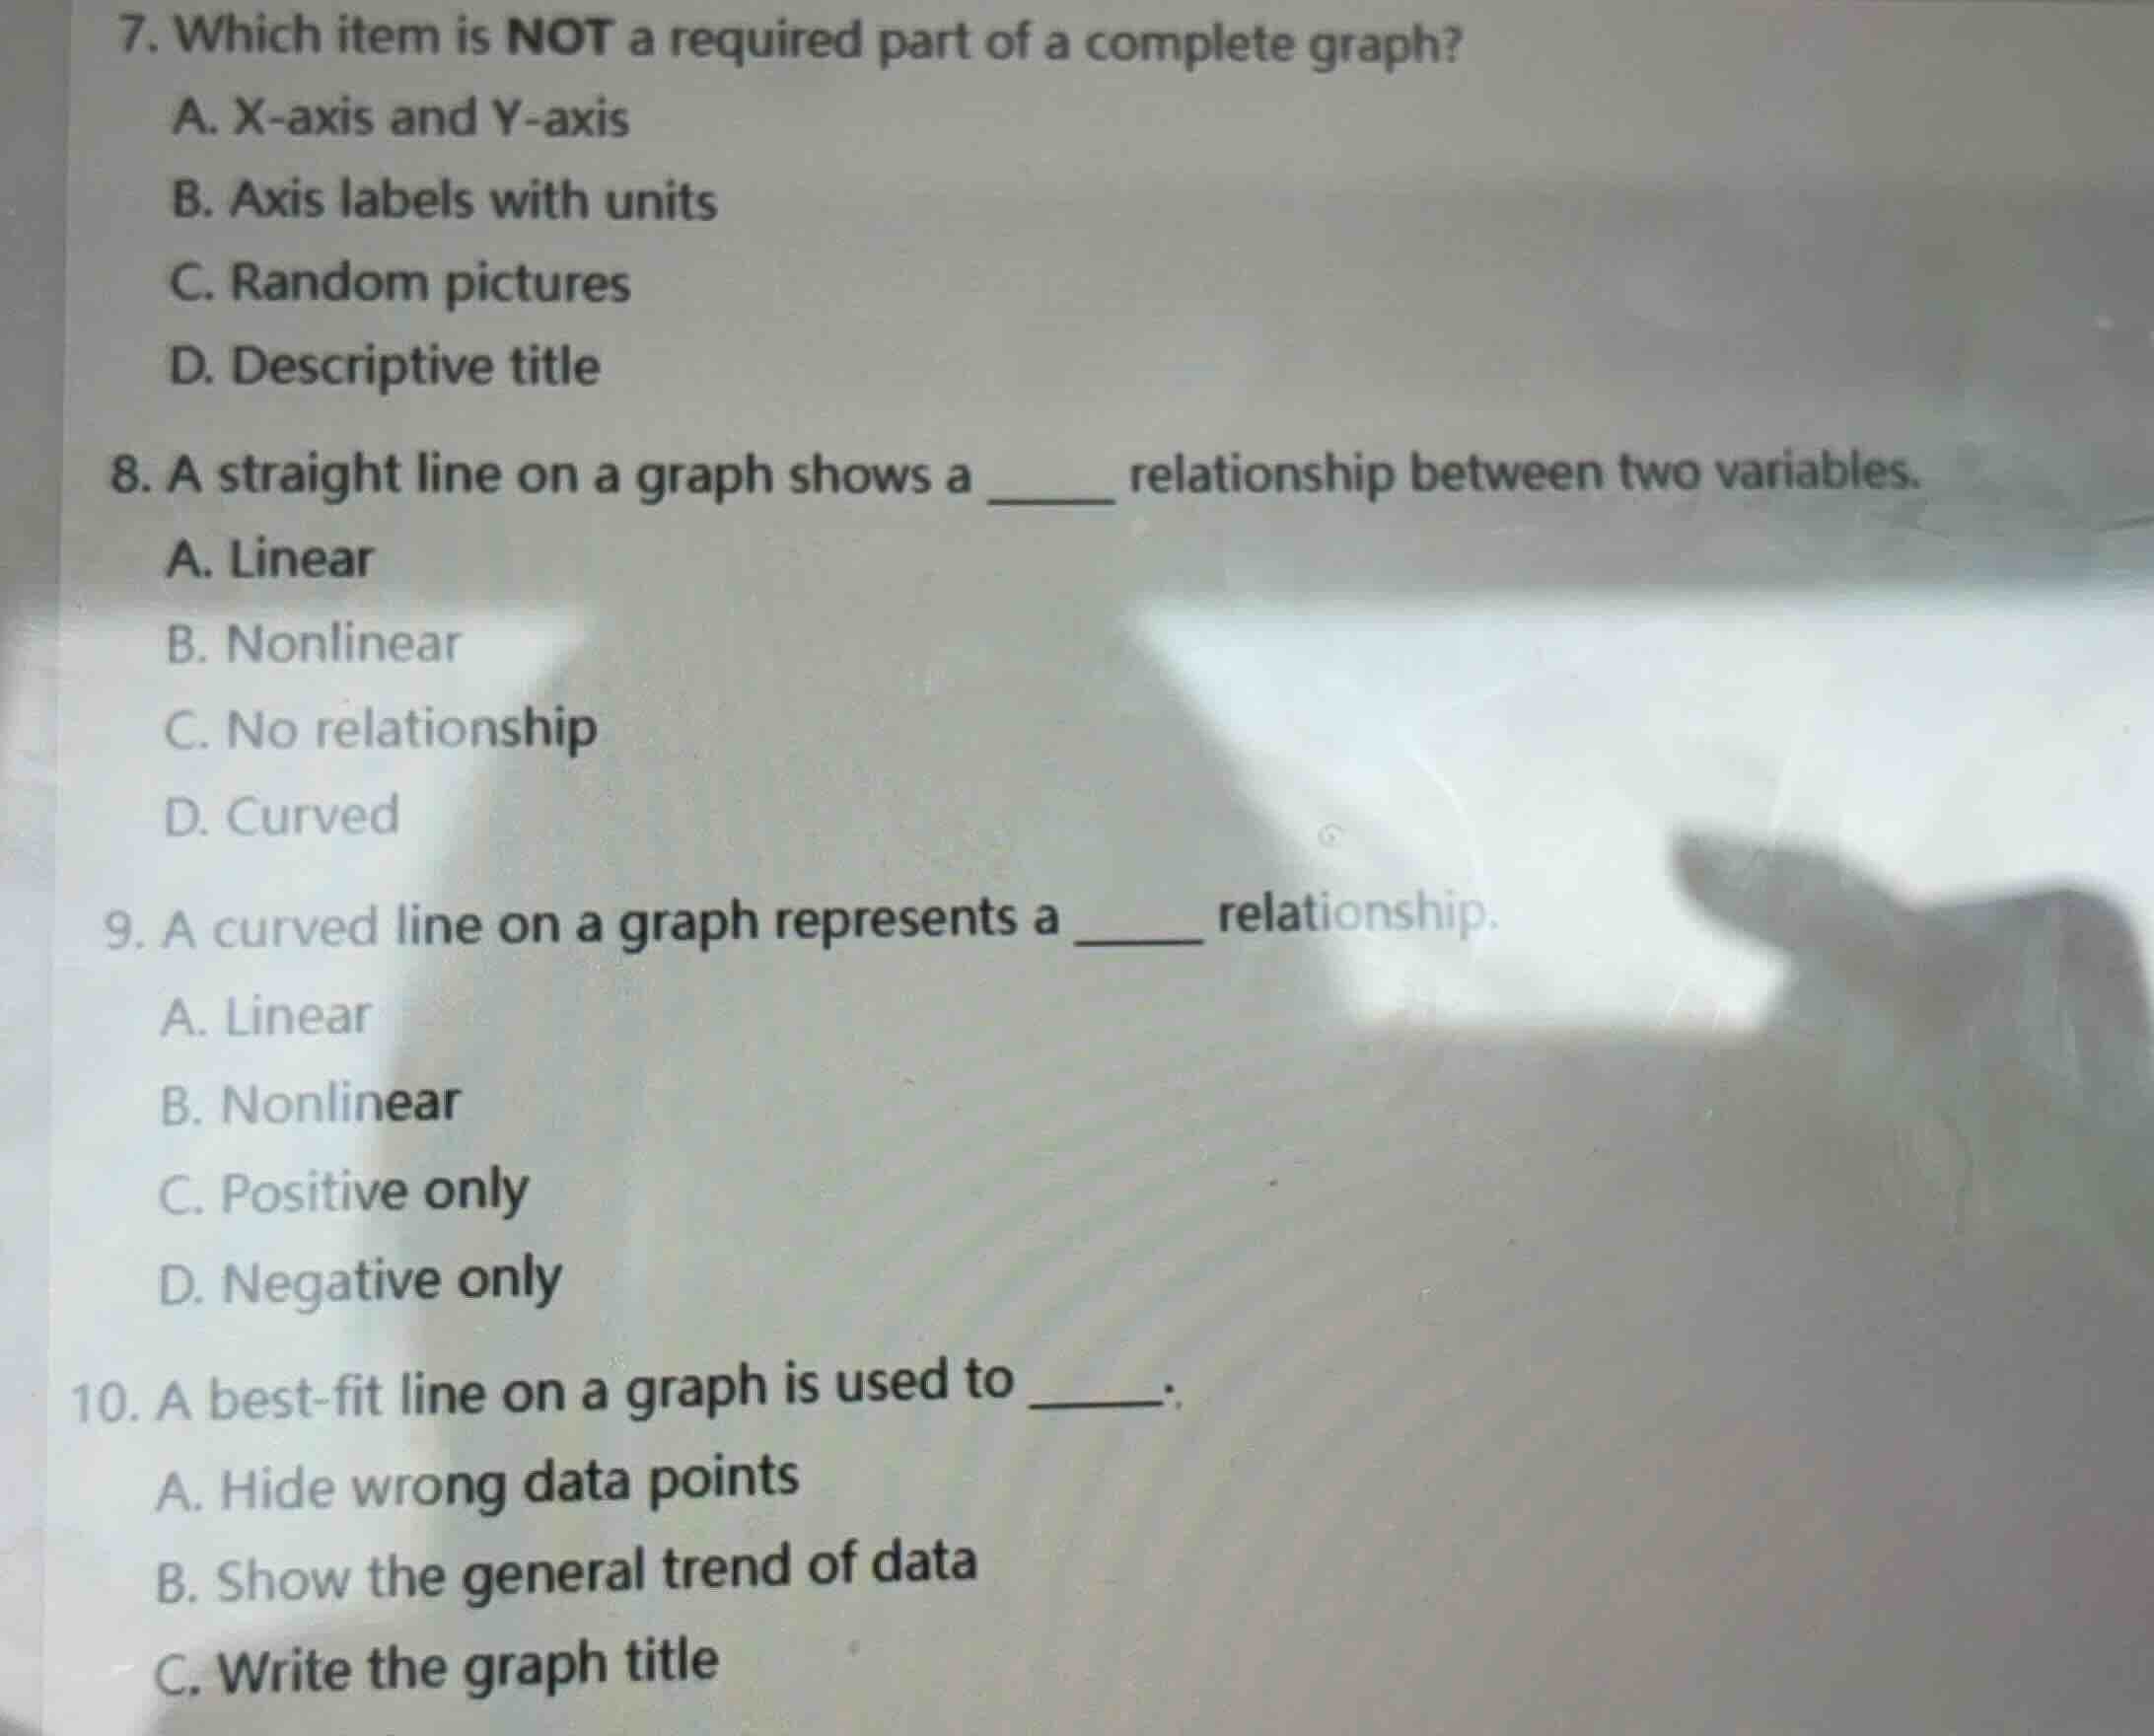
- which item is not a required part of a complete graph?
a. x-axis and y-axis
b. axis labels with units
c. random pictures
d. descriptive title
- a straight line on a graph shows a ______ relationship between two variables.
a. linear
b. nonlinear
c. no relationship
d. curved
- a curved line on a graph represents a ______ relationship.
a. linear
b. nonlinear
c. positive only
d. negative only
- a best-fit line on a graph is used to ______.
a. hide wrong data points
b. show the general trend of data
c. write the graph title
Analyze required parts of a graph
A complete scientific graph requires axes, clear labels with units, and a descriptive title to communicate data. Random pictures are unnecessary and distracting.
Identify straight line relationships
A straight line on a coordinate grid indicates that the rate of change is constant, representing a linear relationship between the variables.
Identify curved line relationships
A curved line shows a rate of change that is not constant, which represents a nonlinear relationship.
Determine the purpose of a best-fit line
A line of best fit is drawn through data points to show the general trend or pattern of the data, rather than hiding points or writing titles.

Snap & solve any problem in the app
Get step-by-step solutions on Sovi AI
Photo-based solutions with guided steps
Explore more problems and detailed explanations
Question 7
- A. X-axis and Y-axis
- B. Axis labels with units
- C. Random pictures (Correct answer)
- D. Descriptive title
Question 8
- A. Linear (Correct answer)
- B. Nonlinear
- C. No relationship
- D. Curved
Question 9
- A. Linear
- B. Nonlinear (Correct answer)
- C. Positive only
- D. Negative only
Question 10
- A. Hide wrong data points
- B. Show the general trend of data (Correct answer)
- C. Write the graph title