QUESTION IMAGE
Question
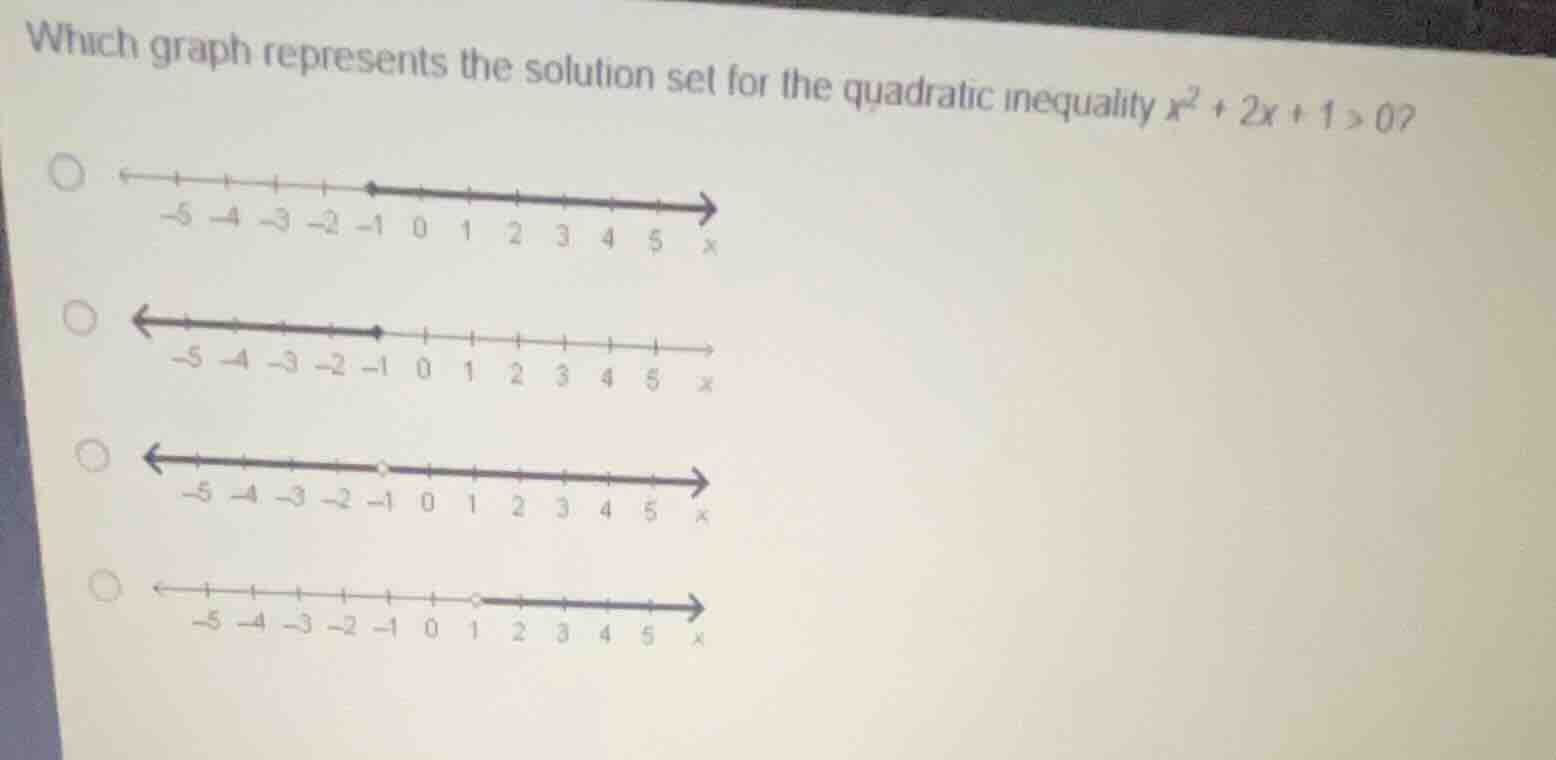
which graph represents the solution set for the quadratic inequality \\(x^2 + 2x + 1 > 0\\)?
Factor the quadratic expression
$$
x^2 + 2x + 1 = (x + 1)^2
$$
Solve the inequality
$$
(x + 1)^2 > 0
$$
$$
x + 1
eq 0 \implies x
eq -1
$$
Identify the corresponding graph
The solution set is all real numbers except \(x = -1\), which is represented on a number line by shading everywhere except for an open circle at \(-1\). This matches the third graph.

Snap & solve any problem in the app
Get step-by-step solutions on Sovi AI
Photo-based solutions with guided steps
Explore more problems and detailed explanations
- (A) Shaded region to the right of \(-1\) with a solid point at \(-1\)
- (B) Shaded region to the left of \(-1\) with a solid point at \(-1\)
- (C) Shaded region in both directions with an open circle at \(-1\) (Correct answer)
- (D) Shaded region to the right of \(1\) with an open circle at \(1\)