QUESTION IMAGE
Question
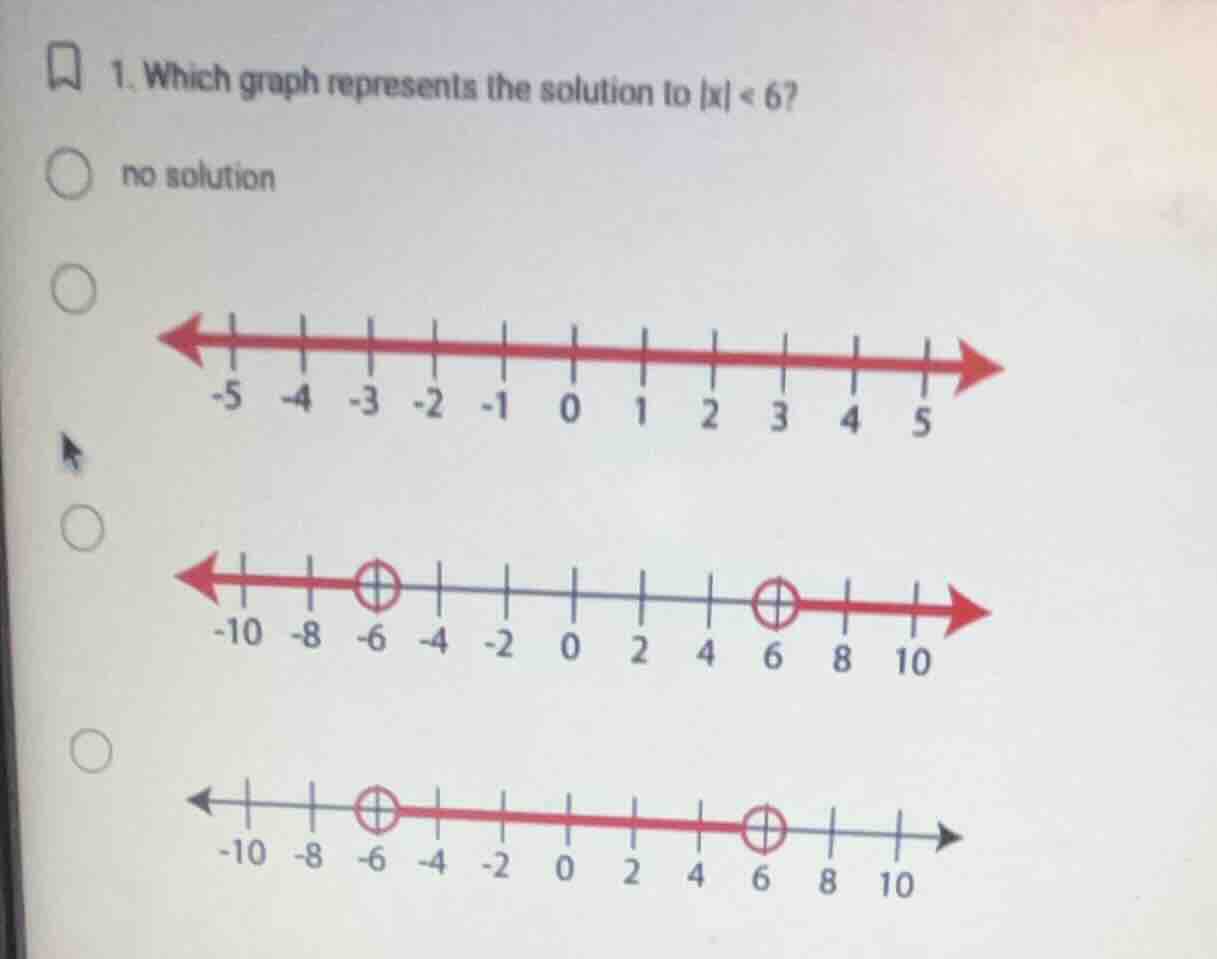
- which graph represents the solution to \\(|x| < 6\\)?
no solution
Interpret the absolute value inequality
Using the Absolute Value Inequalities knowledge point
$$
|x| < 6 \iff -6 < x < 6
$$
Identify the graphical representation
Using the Graphing Inequalities knowledge point
- The solution set is the open interval \((-6, 6)\).
- On a number line, this is represented by open circles at \(-6\) and \(6\) with a shaded line segment connecting them.
- Looking at the options:
- Option 1: "no solution"
- Option 2: Shaded line covering all numbers from \(-5\) to \(5\) (and beyond) with arrows on both ends.
- Option 3: Open circles at \(-6\) and \(6\) with shading pointing outwards to the left and right.
- Option 4: Open circles at \(-6\) and \(6\) with shading between them.
- Therefore, the fourth option is the correct graph.

Snap & solve any problem in the app
Get step-by-step solutions on Sovi AI
Photo-based solutions with guided steps
Explore more problems and detailed explanations
- (A) no solution
- (B) a number line shaded entirely with arrows on both ends
- (C) a number line with open circles at -6 and 6, shaded outwards to the left and right
- (D) a number line with open circles at -6 and 6, shaded between them (Correct answer)