QUESTION IMAGE
Question
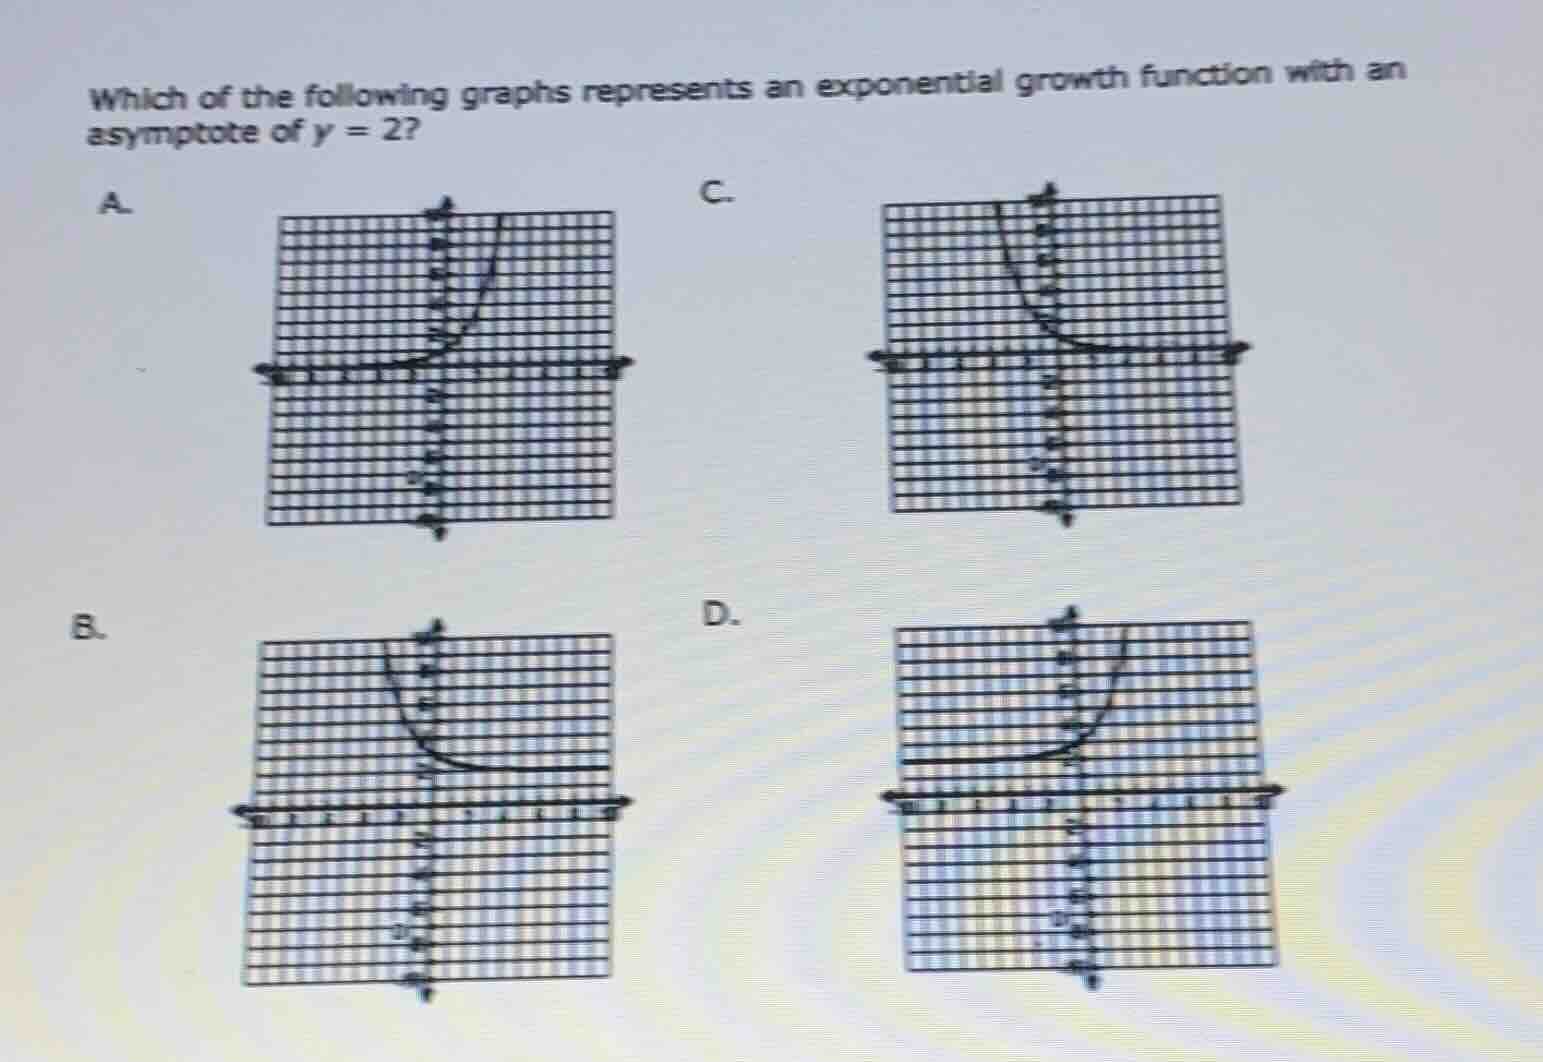
which of the following graphs represents an exponential growth function with an asymptote of \\(y = 2\\)?
Identify exponential growth behavior
Using the Exponential Functions knowledge point, we analyze the shape of the curves.
Exponential growth curves rise from left to right.
Graphs A and D show growth.
Graphs B and C show decay.
Determine the horizontal asymptote
Using the Asymptotes knowledge point, we locate the horizontal boundary line.
The question specifies a horizontal asymptote at \(y = 2\).
In Graph A, the curve approaches the line \(y = 1\).
In Graph D, the curve approaches the line \(y = 2\).
Verify the correct graph
We compare the features of Graph D with our requirements.
Graph D shows a curve rising to the right.
Its horizontal asymptote is clearly at \(y = 2\).
Therefore, Graph D is the correct representation.

Snap & solve any problem in the app
Get step-by-step solutions on Sovi AI
Photo-based solutions with guided steps
Explore more problems and detailed explanations
- A. Exponential growth with asymptote \(y = 1\)
- B. Exponential decay with asymptote \(y = 2\)
- C. Exponential decay with asymptote \(y = 1\)
- D. Exponential growth with asymptote \(y = 2\) (Correct answer)