QUESTION IMAGE
Question
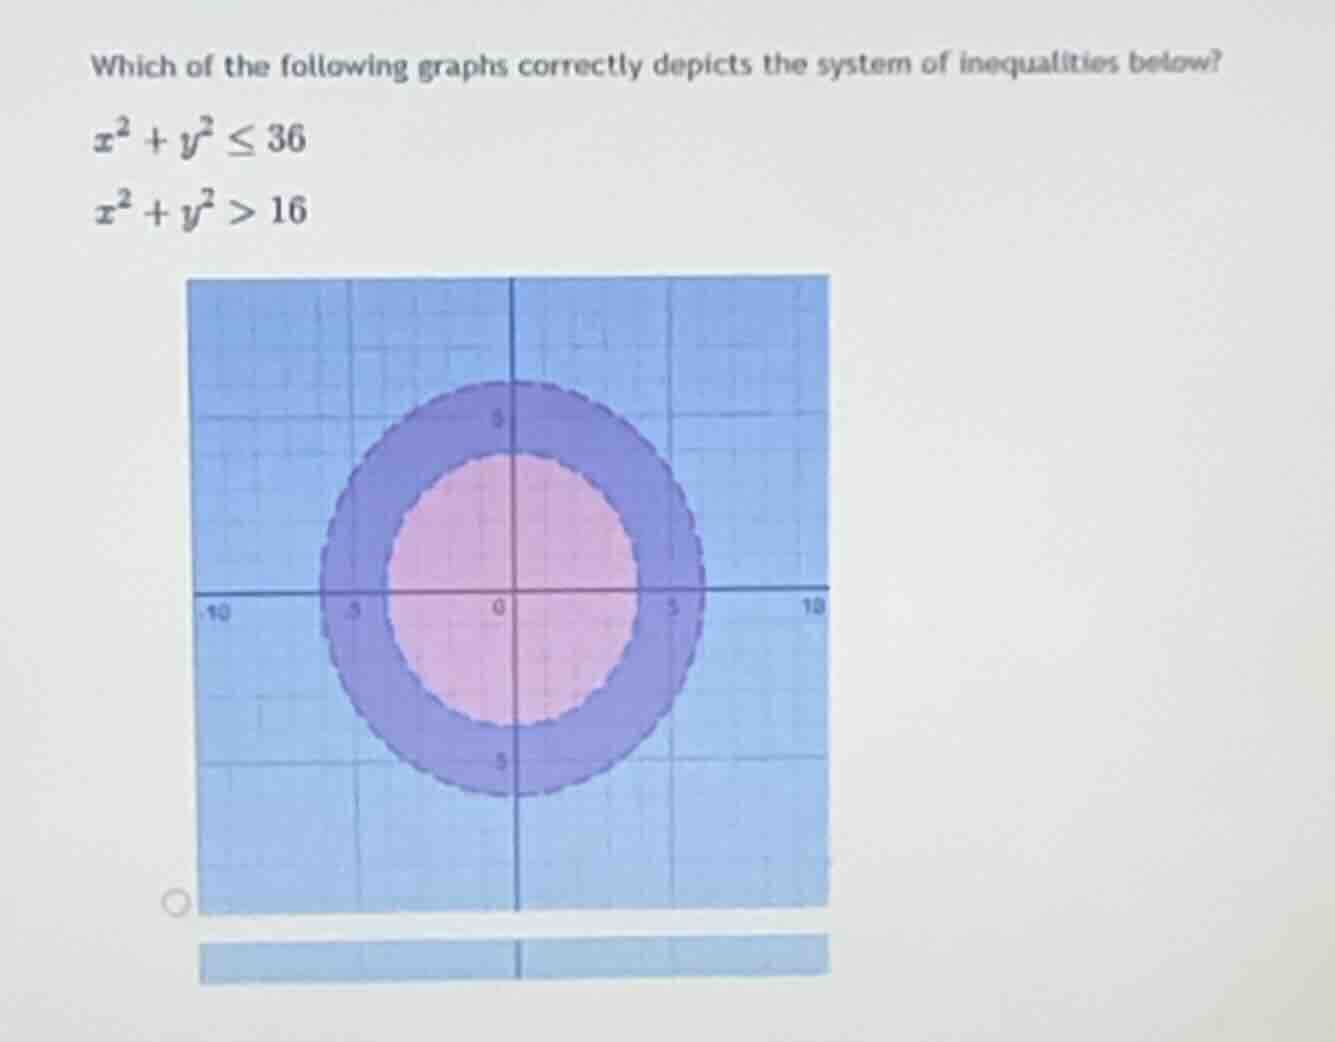
which of the following graphs correctly depicts the system of inequalities below?
\\x^2 + y^2 \le 36\\
\\x^2 + y^2 > 16\\
Step1: Identify the boundary curves
The boundaries are circles centered at the origin:
$$x^2 + y^2 = 36 \implies r = 6$$
$$x^2 + y^2 = 16 \implies r = 4$$
Step2: Determine boundary line styles
The inequality \(x^2 + y^2 \le 36\) uses a solid boundary line.
The inequality \(x^2 + y^2 > 16\) uses a dashed boundary line.
Step3: Determine the shaded region
The solution set lies between the two circles:
$$16 < x^2 + y^2 \le 36$$
This represents the annular region (ring) between radius \(4\) and \(6\).

Snap & solve any problem in the app
Get step-by-step solutions on Sovi AI
Photo-based solutions with guided steps
Explore more problems and detailed explanations
The displayed graph correctly depicts the system of inequalities.