QUESTION IMAGE
13,074 Learners found this answer helpful
Question
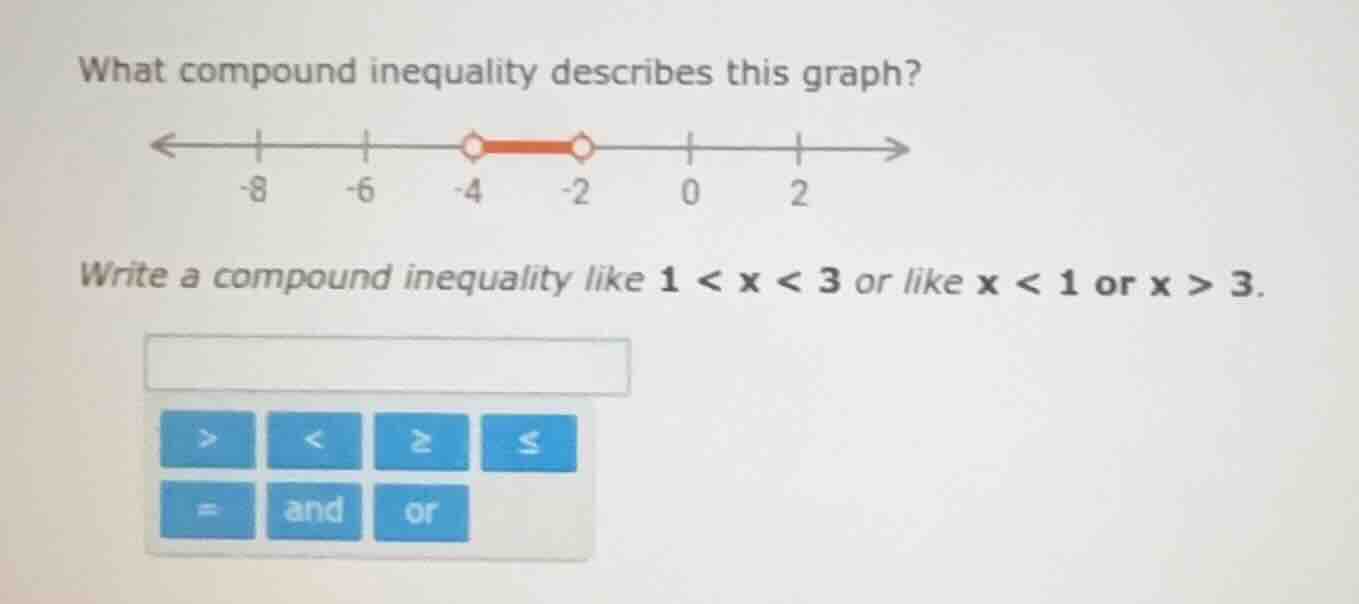
what compound inequality describes this graph?
<----|-8---|-6---|-4(red)-|-2---|0---|2--->
write a compound inequality like 1 < x < 3 or like x < 1 or x > 3.
input box
buttons: >, <, ≥, ≤, =, and, or
Step1: Analyze left endpoint
The open circle at $-4$ means $x > -4$.
Step2: Analyze right endpoint
The open circle at $-2$ means $x < -2$.
Step3: Combine inequalities
The shaded region is between the two points, so use "and".

Snap & solve any problem in the app
Get step-by-step solutions on Sovi AI
Photo-based solutions with guided steps
Explore more problems and detailed explanations
$-4 < x$ and $x < -2$ (or written as $-4 < x < -2$)