QUESTION IMAGE
Question
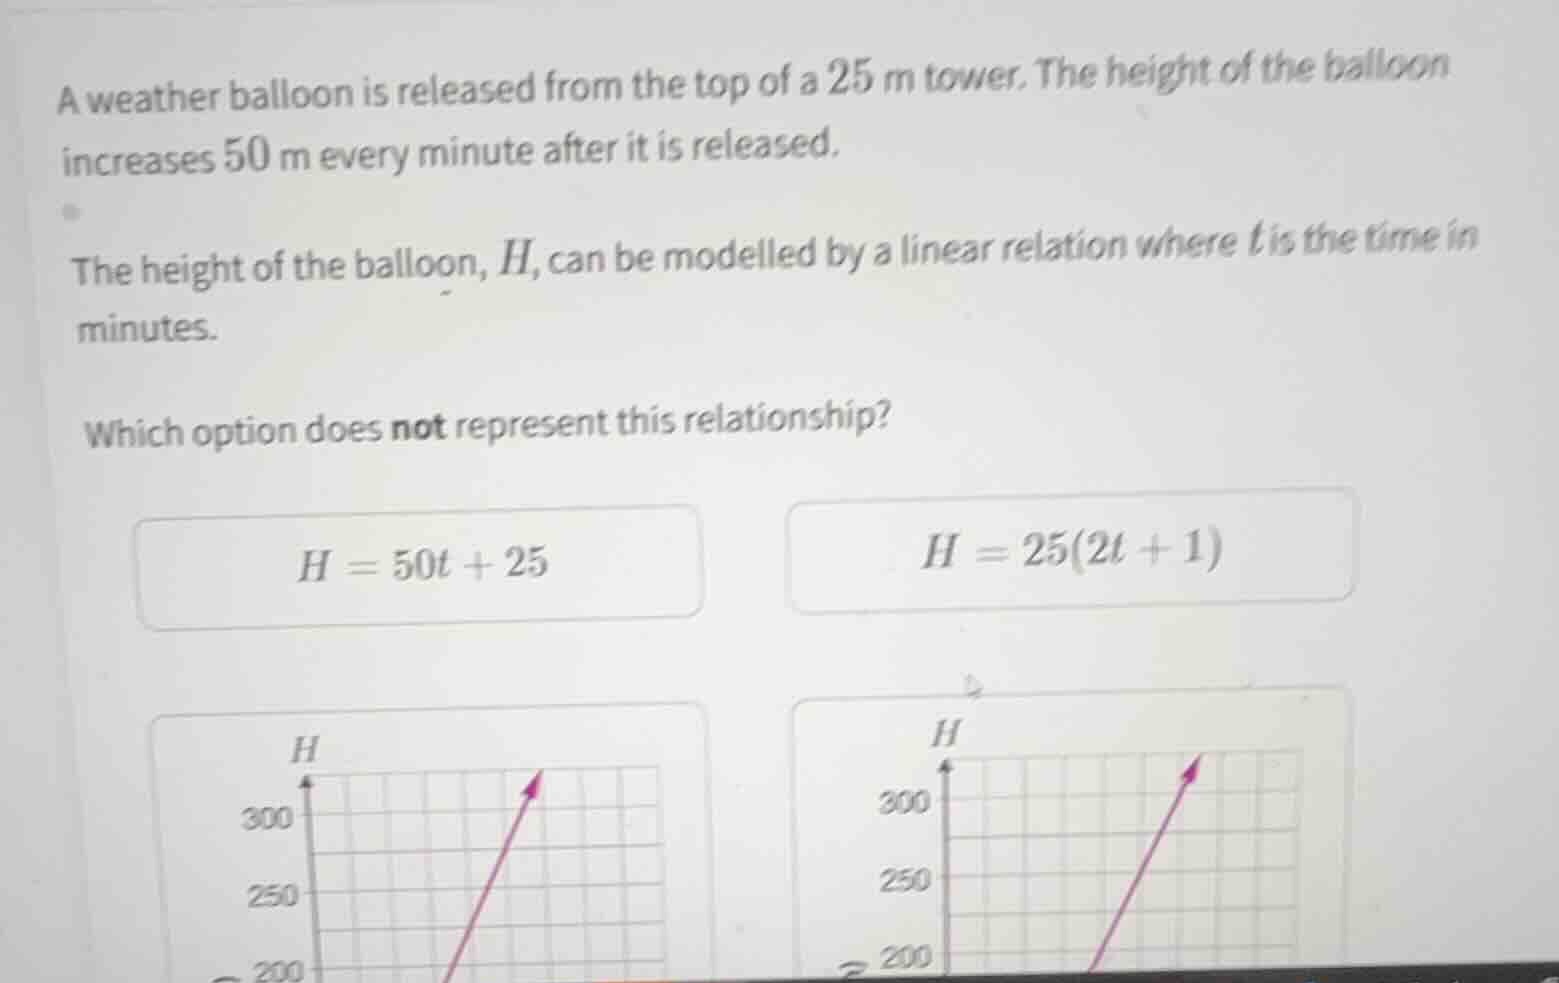
a weather balloon is released from the top of a 25 m tower. the height of the balloon increases 50 m every minute after it is released.
the height of the balloon, \\(h\\), can be modelled by a linear relation where \\(t\\) is the time in minutes.
which option does not represent this relationship?
\\(h = 50t + 25\\)
\\(h = 25(2t + 1)\\)
Identify the initial value and rate
The balloon starts at a height of \(25\text{ m}\) when \(t = 0\).
The height increases by \(50\text{ m}\) every minute.
Using Constant Rate of Change, the rate is \(50\text{ m/min}\).
Formulate the linear equation
Using Linear Relationships, we write the equation:
This represents the height \(H\) at any time \(t\).
Analyze the algebraic options
We factor the equation to check the second option:
Both algebraic options correctly represent the relationship.
Analyze the graphical options
For the graph, when \(t = 0\), the vertical intercept \(H\) must be \(25\).
The left graph shows a line starting below \(200\) on the vertical axis.
The right graph shows a line starting below \(200\) on the vertical axis.
Let's calculate the \(t\)-intercept where \(H = 0\):
The left graph has a horizontal intercept at \(t = -0.5\) (half a grid unit left of the vertical axis).
The right graph has a horizontal intercept at \(t = -4\) (four grid units left of the vertical axis).
Therefore, the right graph does not represent this relationship.

Snap & solve any problem in the app
Get step-by-step solutions on Sovi AI
Photo-based solutions with guided steps
Explore more problems and detailed explanations
- (A) \(H = 50t + 25\)
- (B) \(H = 25(2t + 1)\)
- (C) The graph on the bottom-left
- (D) The graph on the bottom-right (Correct answer)