QUESTION IMAGE
Question
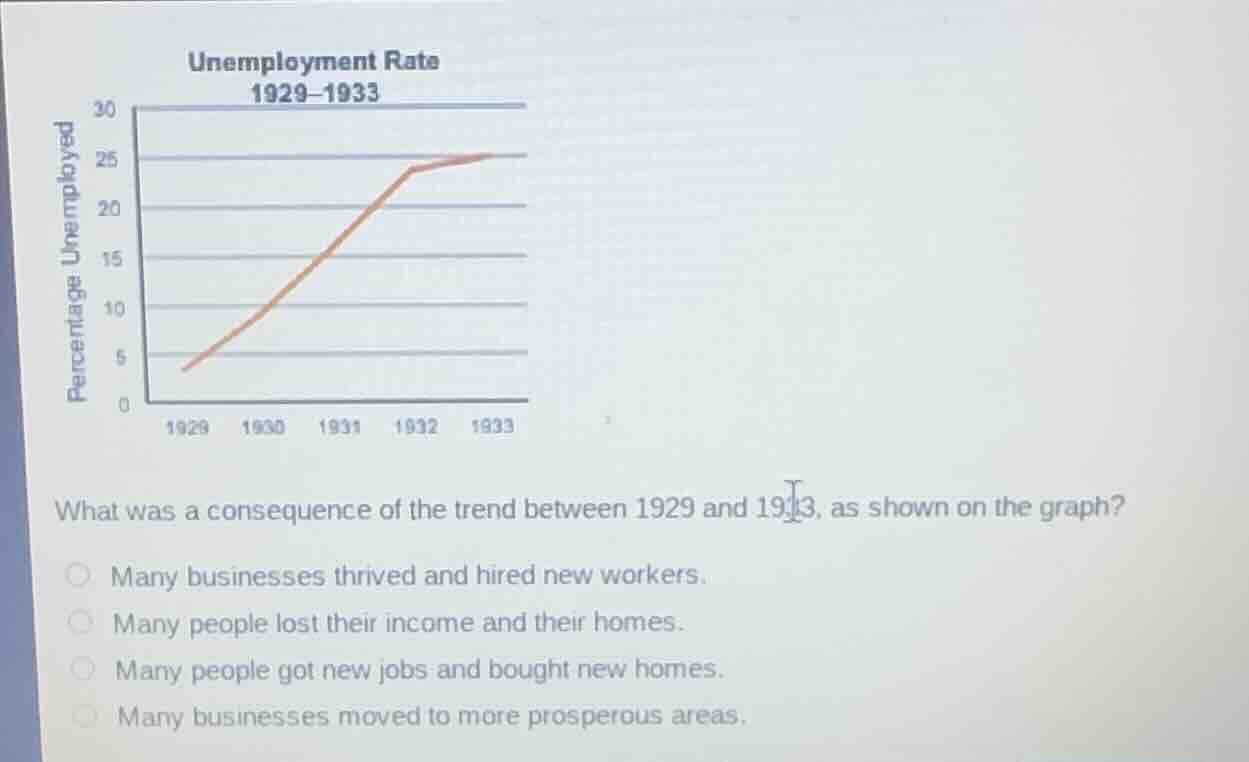
unemployment rate
1929–1933
percentage unemployed
1929 1930 1931 1932 1933
what was a consequence of the trend between 1929 and 1933, as shown on the graph?
many businesses thrived and hired new workers.
many people lost their income and their homes.
many people got new jobs and bought new homes.
many businesses moved to more prosperous areas.
The graph shows a sharp rise in the unemployment rate from 1929 to 1933, which corresponds to the Great Depression. High unemployment means large numbers of people lose their jobs, and without income, many cannot afford housing payments, leading to loss of homes. The other options contradict the negative economic impact of mass unemployment.

Snap & solve any problem in the app
Get step-by-step solutions on Sovi AI
Photo-based solutions with guided steps
Explore more problems and detailed explanations
Many people lost their income and their homes.