QUESTION IMAGE
Question
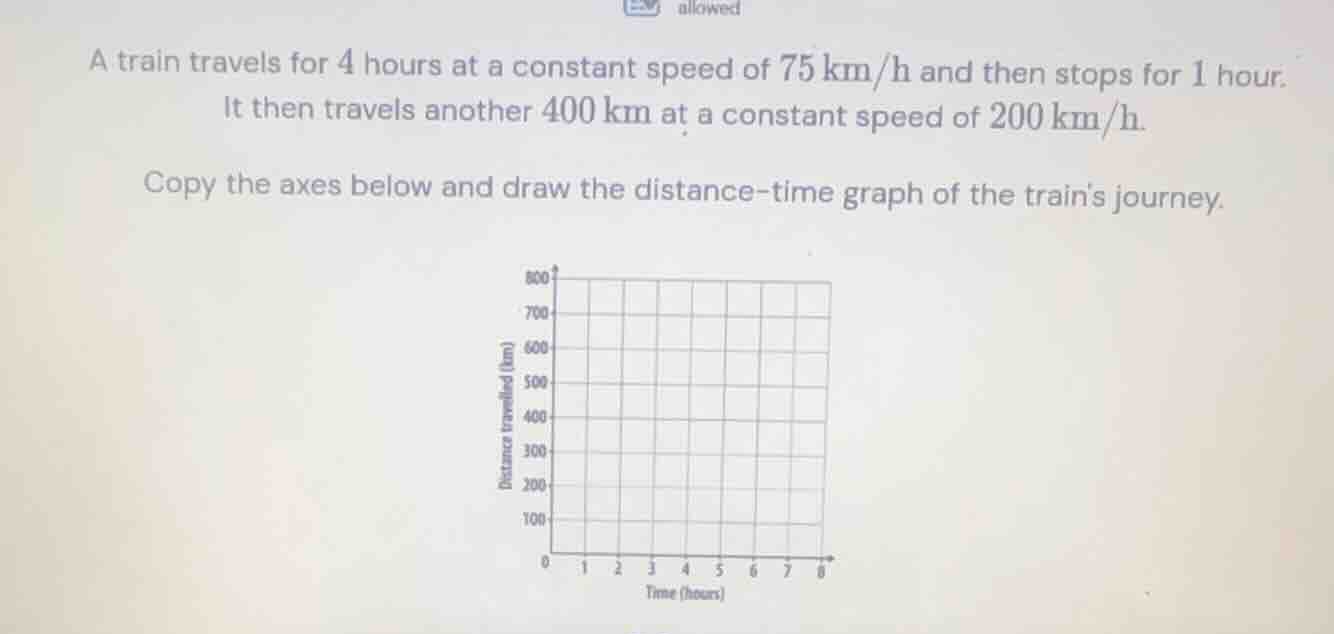
a train travels for 4 hours at a constant speed of 75 km/h and then stops for 1 hour. it then travels another 400 km at a constant speed of 200 km/h.
copy the axes below and draw the distance-time graph of the trains journey.
<pre_analysis>
{
"quality": "clear",
"question_count": 1,
"skills_matched": [
"step_cot",
"explain_then_answer",
"tutor"
],
"needs_drawing": true,
"concepts_used": [
"Distance-Time Graphs",
"Constant Speed Calculation"
],
"new_concepts": [],
"current_concepts": [
"Distance-Time Graphs",
"Constant Speed Calculation"
]
}
</pre_analysis>
<reasoning>
Calculate the first leg of the journey
Using the Constant Speed Calculation and Distance-Time Graphs knowledge points:
- Time: \(t_1 = 4\text{ hours}\)
- Speed: \(v_1 = 75\text{ km/h}\)
- Distance: \(d_1 = v_1 \times t_1 = 75 \times 4 = 300\text{ km}\)
- End point of first leg: \((4, 300)\)
Calculate the second leg (stationary period)
Using the Distance-Time Graphs knowledge point:
- The train stops for \(1\text{ hour}\).
- Time interval: from \(t = 4\) to \(t = 5\text{ hours}\).
- Distance remains constant at \(300\text{ km}\).
- End point of second leg: \((5, 300)\)
Calculate the third leg of the journey
Using the Constant Speed Calculation and Distance-Time Graphs knowledge points:
- Additional distance: \(\Delta d = 400\text{ km}\)
- Speed: \(v_3 = 200\text{ km/h}\)
- Time taken: \(\Delta t = \frac{\Delta d}{v_3} = \frac{400}{200} = 2\text{ hours}\)
- Total time: \(t_3 = 5 + 2 = 7\text{ hours}\)
- Total distance: \(d_3 = 300 + 400 = 700\text{ km}\)
- End point of third leg: \((7, 700)\)
Summarize the coordinates for plotting
Using the Distance-Time Graphs knowledge point:
The journey starts at the origin and is represented by three straight line segments connecting the following coordinates:
- Start: \((0, 0)\)
- End of first leg: \((4, 300)\)
- End of stop: \((5, 300)\)
- End of journey: \((7, 700)\)
</reasoning>
<answer>
To draw the distance-time graph of the train's journey, plot the following key coordinate points \((t, d)\), where \(t\) is the time in hours and \(d\) is the distance in kilometers, and connect them with straight line segments:
- Start of journey: \((0, 0)\)
- End of first leg (constant speed of \(75\text{ km/h}\) for \(4\text{ hours}\)): \((4, 300)\)
- End of stop (stationary for \(1\text{ hour}\)): \((5, 300)\)
- End of second leg (travels another \(400\text{ km}\) at \(200\text{ km/h}\) for \(2\text{ hours}\)): \((7, 700)\)
</answer>
<plot>
{
"elements": [
{
"type": "point",
"params": [[0, 0]],
"properties": {
"name": "Start (0,0)",
"size": 3,
"color": "#8C55F2",
"withLabel": true
}
},
{
"type": "point",
"params": [[4, 3]],
"properties": {
"name": "A (4, 300)",
"size": 3,
"color": "#8C55F2",
"withLabel": true
}
},
{
"type": "point",
"params": [[5, 3]],
"properties": {
"name": "B (5, 300)",
"size": 3,
"color": "#8C55F2",
"withLabel": true
}
},
{
"type": "point",
"params": [[7, 7]],
"properties": {
"name": "End (7, 700)",
"size": 3,
"color": "#8C55F2",
"withLabel": true
}
},
{
"type": "segment",
"params": [[0, 0], [4, 3]],
"properties": {
"strokeColor": "#5583F2",
"strokeWidth": 3
}
},
{
"type": "segment",
"params": [[4, 3], [5, 3]],
"properties": {
"strokeColor": "#F2557F",
"strokeWidth": 3
}
},
{
"type": "segment",
"params": [[5, 3], [7, 7]],
"properties": {
"strokeColor": "#…

Snap & solve any problem in the app
Get step-by-step solutions on Sovi AI
Photo-based solutions with guided steps
Explore more problems and detailed explanations
<pre_analysis>
{
"quality": "clear",
"question_count": 1,
"skills_matched": [
"step_cot",
"explain_then_answer",
"tutor"
],
"needs_drawing": true,
"concepts_used": [
"Distance-Time Graphs",
"Constant Speed Calculation"
],
"new_concepts": [],
"current_concepts": [
"Distance-Time Graphs",
"Constant Speed Calculation"
]
}
</pre_analysis>
<reasoning>
Calculate the first leg of the journey
Using the Constant Speed Calculation and Distance-Time Graphs knowledge points:
- Time: \(t_1 = 4\text{ hours}\)
- Speed: \(v_1 = 75\text{ km/h}\)
- Distance: \(d_1 = v_1 \times t_1 = 75 \times 4 = 300\text{ km}\)
- End point of first leg: \((4, 300)\)
Calculate the second leg (stationary period)
Using the Distance-Time Graphs knowledge point:
- The train stops for \(1\text{ hour}\).
- Time interval: from \(t = 4\) to \(t = 5\text{ hours}\).
- Distance remains constant at \(300\text{ km}\).
- End point of second leg: \((5, 300)\)
Calculate the third leg of the journey
Using the Constant Speed Calculation and Distance-Time Graphs knowledge points:
- Additional distance: \(\Delta d = 400\text{ km}\)
- Speed: \(v_3 = 200\text{ km/h}\)
- Time taken: \(\Delta t = \frac{\Delta d}{v_3} = \frac{400}{200} = 2\text{ hours}\)
- Total time: \(t_3 = 5 + 2 = 7\text{ hours}\)
- Total distance: \(d_3 = 300 + 400 = 700\text{ km}\)
- End point of third leg: \((7, 700)\)
Summarize the coordinates for plotting
Using the Distance-Time Graphs knowledge point:
The journey starts at the origin and is represented by three straight line segments connecting the following coordinates:
- Start: \((0, 0)\)
- End of first leg: \((4, 300)\)
- End of stop: \((5, 300)\)
- End of journey: \((7, 700)\)
</reasoning>
<answer>
To draw the distance-time graph of the train's journey, plot the following key coordinate points \((t, d)\), where \(t\) is the time in hours and \(d\) is the distance in kilometers, and connect them with straight line segments:
- Start of journey: \((0, 0)\)
- End of first leg (constant speed of \(75\text{ km/h}\) for \(4\text{ hours}\)): \((4, 300)\)
- End of stop (stationary for \(1\text{ hour}\)): \((5, 300)\)
- End of second leg (travels another \(400\text{ km}\) at \(200\text{ km/h}\) for \(2\text{ hours}\)): \((7, 700)\)
</answer>
<plot>
{
"elements": [
{
"type": "point",
"params": [[0, 0]],
"properties": {
"name": "Start (0,0)",
"size": 3,
"color": "#8C55F2",
"withLabel": true
}
},
{
"type": "point",
"params": [[4, 3]],
"properties": {
"name": "A (4, 300)",
"size": 3,
"color": "#8C55F2",
"withLabel": true
}
},
{
"type": "point",
"params": [[5, 3]],
"properties": {
"name": "B (5, 300)",
"size": 3,
"color": "#8C55F2",
"withLabel": true
}
},
{
"type": "point",
"params": [[7, 7]],
"properties": {
"name": "End (7, 700)",
"size": 3,
"color": "#8C55F2",
"withLabel": true
}
},
{
"type": "segment",
"params": [[0, 0], [4, 3]],
"properties": {
"strokeColor": "#5583F2",
"strokeWidth": 3
}
},
{
"type": "segment",
"params": [[4, 3], [5, 3]],
"properties": {
"strokeColor": "#F2557F",
"strokeWidth": 3
}
},
{
"type": "segment",
"params": [[5, 3], [7, 7]],
"properties": {
"strokeColor": "#5583F2",
"strokeWidth": 3
}
}
]
}
</plot>
<post_analysis>
{
"subject": "Mathematics",
"question_type": "Free Response",
"knowledge_point": [
"Mathematics",
"Geometry",
"Distance-Time Graphs"
]
}
</post_analysis>