QUESTION IMAGE
Question
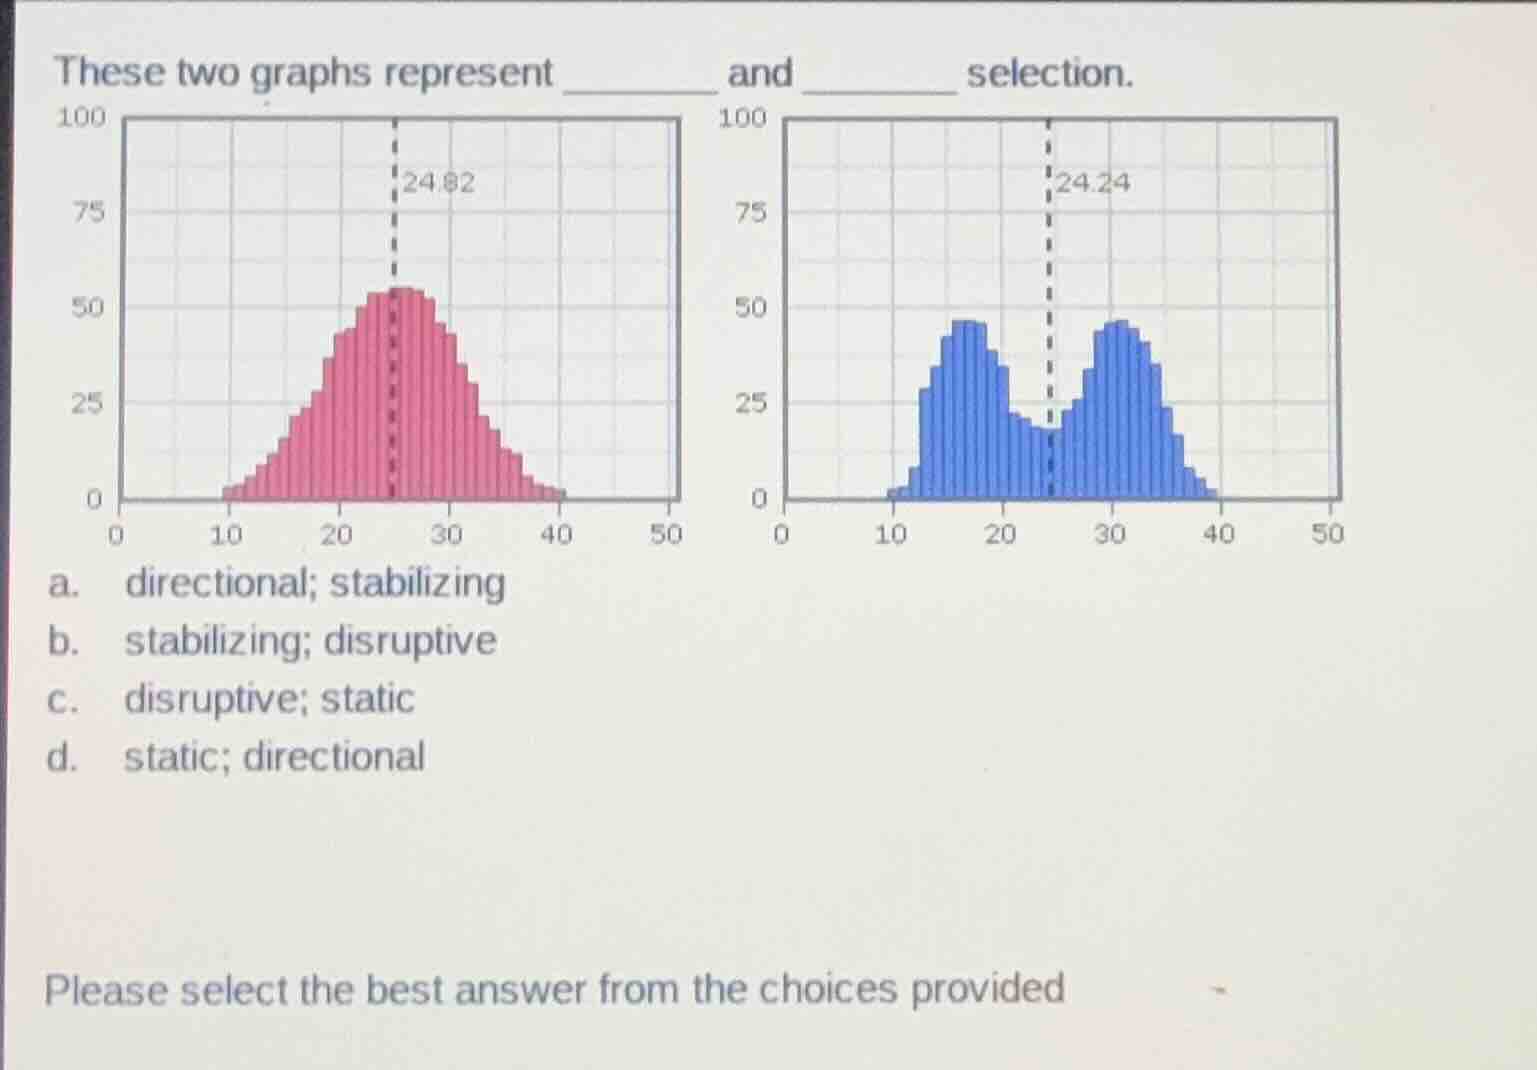
these two graphs represent ____ and ____ selection.
a. directional; stabilizing
b. stabilizing; disruptive
c. disruptive; static
d. static; directional
please select the best answer from the choices provided
Step1: Identify the first graph's selection type
The first graph shows a single peak centered around the mean value, indicating selection against extreme phenotypes.
$$\text{First Graph} = \text{stabilizing selection}$$
Step2: Identify the second graph's selection type
The second graph shows two distinct peaks at the extremes with a dip at the mean, indicating selection against intermediate phenotypes.
$$\text{Second Graph} = \text{disruptive selection}$$

Snap & solve any problem in the app
Get step-by-step solutions on Sovi AI
Photo-based solutions with guided steps
Explore more problems and detailed explanations
b. stabilizing; disruptive