QUESTION IMAGE
Question
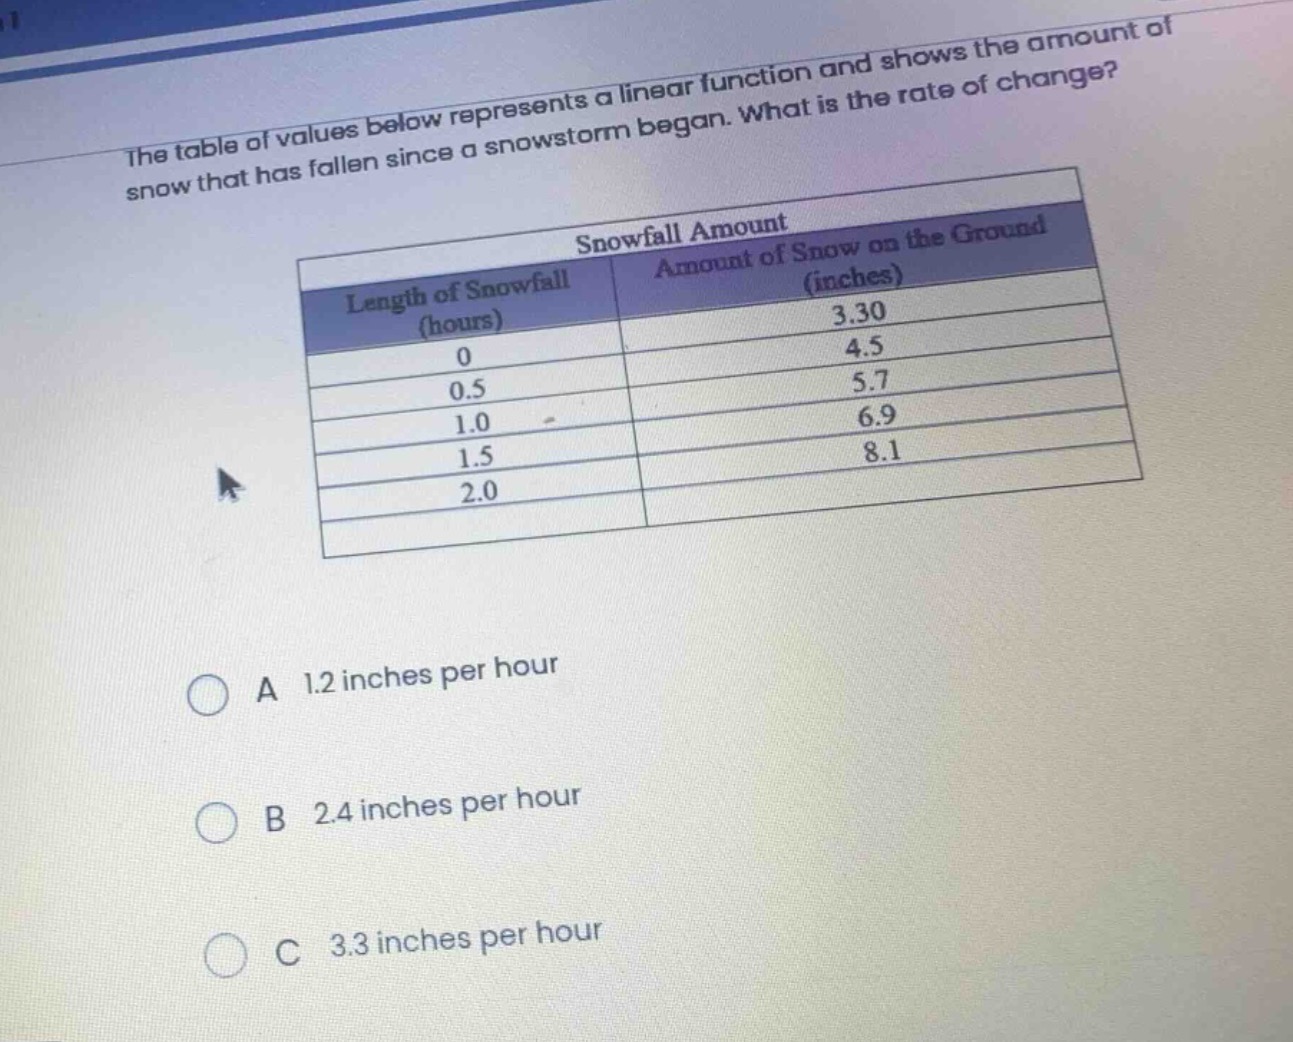
the table of values below represents a linear function and shows the amount of snow that has fallen since a snowstorm began. what is the rate of change?
\
$$\begin{tabular}{|c|c|}
\\hline
\\multicolumn{2}{|c|}{snowfall amount} \\\\
\\hline
length of snowfall (hours) & amount of snow on the ground (inches) \\\\
\\hline
0 & 3.30 \\\\
\\hline
0.5 & 4.5 \\\\
\\hline
1.0 & 5.7 \\\\
\\hline
1.5 & 6.9 \\\\
\\hline
2.0 & 8.1 \\\\
\\hline
\\end{tabular}$$
a 1.2 inches per hour
b 2.4 inches per hour
c 3.3 inches per hour
⚡ Using what you learned: Rate of Change and Applications
Step 1: Identify coordinates
Select two points from the table:
$$ (x_1, y_1) = (0, 3.30) $$
$$ (x_2, y_2) = (0.5, 4.5) $$
Step 2: Calculate rate of change
$$ \text{Rate of Change} = \frac{y_2 - y_1}{x_2 - x_1} $$
$$ \text{Rate of Change} = \frac{4.5 - 3.30}{0.5 - 0} $$
$$ \text{Rate of Change} = \frac{1.2}{0.5} = 2.4 $$

Snap & solve any problem in the app
Get step-by-step solutions on Sovi AI
Photo-based solutions with guided steps
Explore more problems and detailed explanations
B 2.4 inches per hour