QUESTION IMAGE
Question
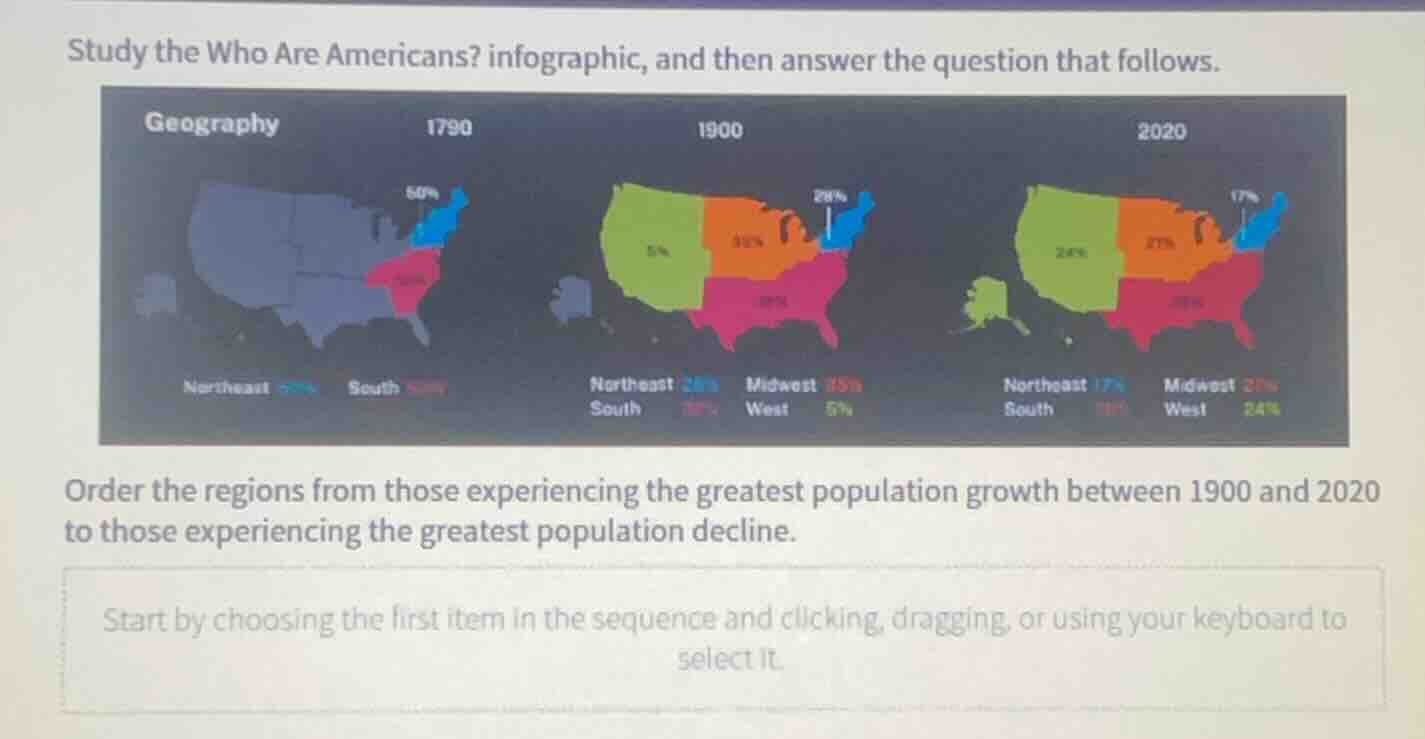
study the who are americans? infographic, and then answer the question that follows.
order the regions from those experiencing the greatest population growth between 1900 and 2020 to those experiencing the greatest population decline.
start by choosing the first item in the sequence and clicking, dragging, or using your keyboard to select it.
Analyze regional population shares in 1900 and 2020
- West: \(5\%\) in 1900 \(
ightarrow\) \(24\%\) in 2020 (Change: \(+19\%\))
- South: \(38\%\) in 1900 \(
ightarrow\) \(38\%\) in 2020 (Change: \(0\%\))
- Midwest: \(29\%\) in 1900 \(
ightarrow\) \(21\%\) in 2020 (Change: \(-8\%\))
- Northeast: \(28\%\) in 1900 \(
ightarrow\) \(17\%\) in 2020 (Change: \(-11\%\))
Order the regions by population share change
- Greatest growth to greatest decline:
- West (\(+19\%\))
- South (\(0\%\))
- Midwest (\(-8\%\))
- Northeast (\(-11\%\))

Snap & solve any problem in the app
Get step-by-step solutions on Sovi AI
Photo-based solutions with guided steps
Explore more problems and detailed explanations
- West
- South
- Midwest
- Northeast