QUESTION IMAGE
Question
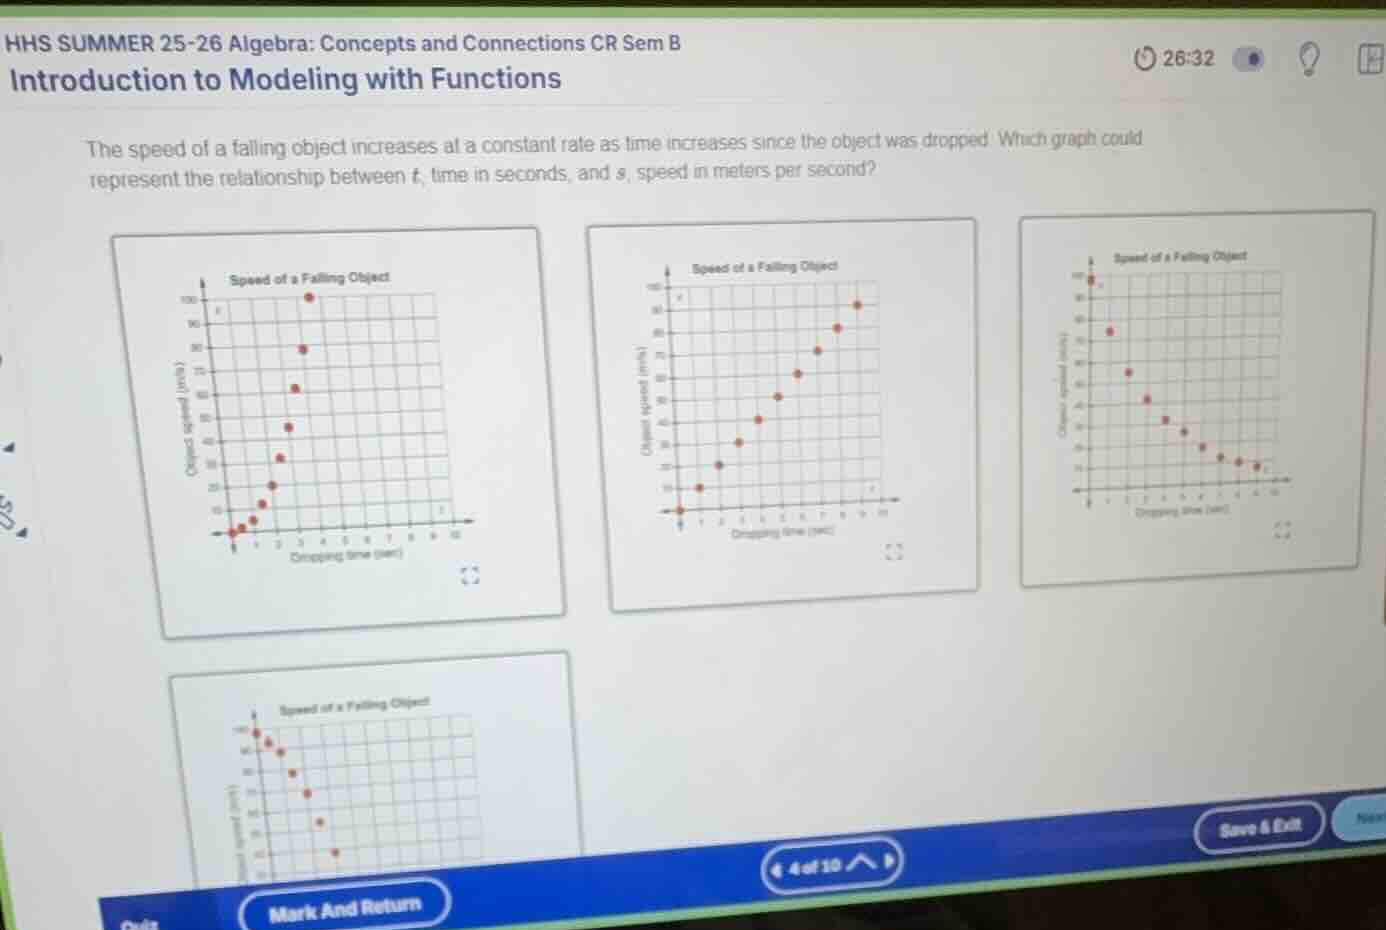
the speed of a falling object increases at a constant rate as time increases since the object was dropped. which graph could represent the relationship between \\(t\\), time in seconds, and \\(s\\), speed in meters per second?
Analyze the rate of change
Using the Function Modeling knowledge point
- The problem states that the speed increases at a "constant rate" over time.
- A constant rate of change represents a linear relationship, which is graphed as a straight line.
Identify the initial state
- The object is "dropped", meaning its initial speed at time \(t = 0\) is \(s = 0\).
- The graph must start at the origin \((0, 0)\).
Evaluate the graph options
- Graph 1 (top-left) shows an increasing curve that is not straight (exponential or quadratic growth).
- Graph 2 (top-middle) shows a straight line of points starting at \((0,0)\) and increasing at a constant rate.
- Graph 3 (top-right) shows a decreasing curve.
- Graph 4 (bottom-left) shows a decreasing straight line.
- Therefore, the second graph (top-middle) correctly represents the relationship.

Snap & solve any problem in the app
Get step-by-step solutions on Sovi AI
Photo-based solutions with guided steps
Explore more problems and detailed explanations
- (A) Graph showing an upward curve starting at (0,0)
- (B) Graph showing a straight line of points increasing from (0,0) (Correct answer)
- (C) Graph showing a downward curve
- (D) Graph showing a straight line of points decreasing