QUESTION IMAGE
Question
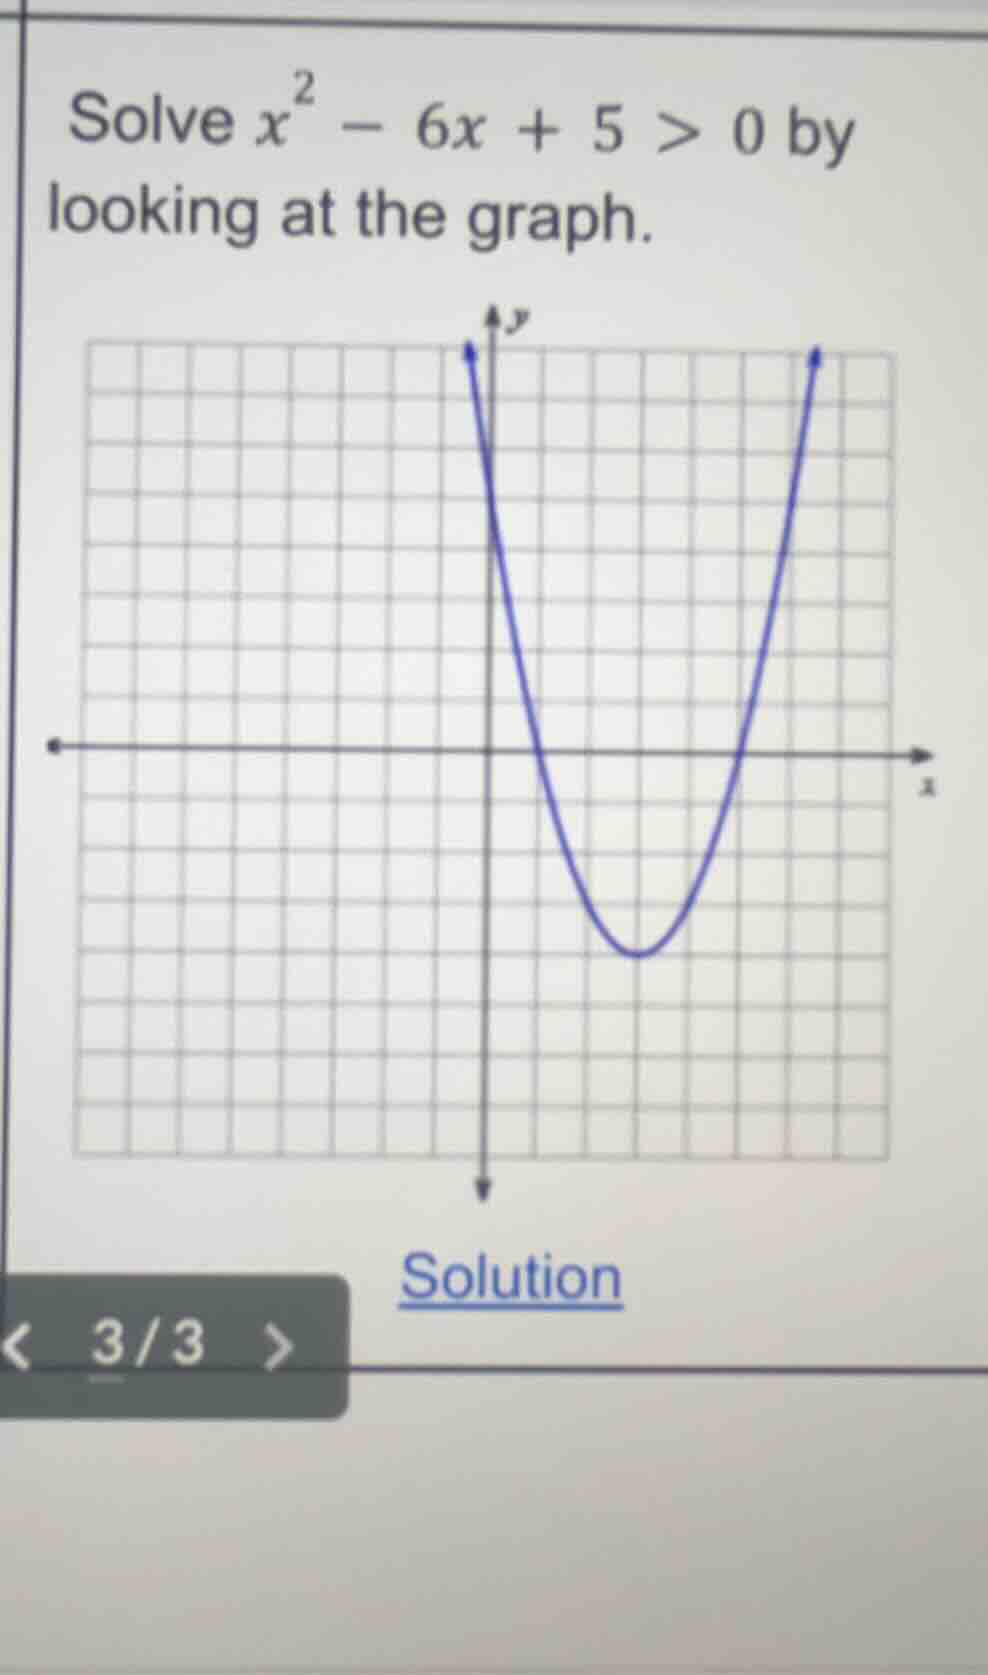
solve \\(x^2 - 6x + 5 > 0\\) by looking at the graph.
<pre_analysis>
{
"quality": "clear",
"question_count": 1,
"skills_matched": [
"step_cot",
"explain_then_answer",
"quick"
],
"needs_drawing": true,
"concepts_used": [],
"new_concepts": [
"Solving Quadratic Inequalities Graphically"
],
"current_concepts": [
"Quadratic Inequalities",
"Graphing Inequalities",
"Solving Quadratic Inequalities Graphically"
]
}
</pre_analysis>
<reasoning>
Identify x-intercepts from the graph
\[
x = 1 \quad \text{and} \quad x = 5
\]
Determine where the graph is above the x-axis
\[
y > 0 \implies x < 1 \quad \text{or} \quad x > 5
\]
Express the solution in interval notation
\[
(-\infty, 1) \cup (5, \infty)
\]
</reasoning>
<answer>
\(x < 1\) or \(x > 5\) (or in interval notation: \((-\infty, 1) \cup (5, \infty)\))
</answer>
<plot>
{
"elements": [
{
"type": "functiongraph",
"params": [
{
"js": "xx - 6x + 5",
"latex": "x^2 - 6x + 5"
},
-2,
8
],
"properties": {
"strokeColor": "#8C55F2",
"strokeWidth": 3,
"name": "y = x^2 - 6x + 5",
"withLabel": true
}
},
{
"type": "point",
"params": [[1, 0]],
"properties": {
"name": "(1,0)",
"color": "#F2557F",
"size": 4,
"withLabel": true
}
},
{
"type": "point",
"params": [[5, 0]],
"properties": {
"name": "(5,0)",
"color": "#F2557F",
"size": 4,
"withLabel": true
}
}
],
"timestamps": [0.5, 1.0]
}
</plot>
<post_analysis>
{
"subject": "Mathematics",
"question_type": "Free Response",
"knowledge_point": [
"Mathematics",
"Algebra",
"Quadratic Inequalities"
]
}
</post_analysis>

Snap & solve any problem in the app
Get step-by-step solutions on Sovi AI
Photo-based solutions with guided steps
Explore more problems and detailed explanations
<pre_analysis>
{
"quality": "clear",
"question_count": 1,
"skills_matched": [
"step_cot",
"explain_then_answer",
"quick"
],
"needs_drawing": true,
"concepts_used": [],
"new_concepts": [
"Solving Quadratic Inequalities Graphically"
],
"current_concepts": [
"Quadratic Inequalities",
"Graphing Inequalities",
"Solving Quadratic Inequalities Graphically"
]
}
</pre_analysis>
<reasoning>
Identify x-intercepts from the graph
\[
x = 1 \quad \text{and} \quad x = 5
\]
Determine where the graph is above the x-axis
\[
y > 0 \implies x < 1 \quad \text{or} \quad x > 5
\]
Express the solution in interval notation
\[
(-\infty, 1) \cup (5, \infty)
\]
</reasoning>
<answer>
\(x < 1\) or \(x > 5\) (or in interval notation: \((-\infty, 1) \cup (5, \infty)\))
</answer>
<plot>
{
"elements": [
{
"type": "functiongraph",
"params": [
{
"js": "xx - 6x + 5",
"latex": "x^2 - 6x + 5"
},
-2,
8
],
"properties": {
"strokeColor": "#8C55F2",
"strokeWidth": 3,
"name": "y = x^2 - 6x + 5",
"withLabel": true
}
},
{
"type": "point",
"params": [[1, 0]],
"properties": {
"name": "(1,0)",
"color": "#F2557F",
"size": 4,
"withLabel": true
}
},
{
"type": "point",
"params": [[5, 0]],
"properties": {
"name": "(5,0)",
"color": "#F2557F",
"size": 4,
"withLabel": true
}
}
],
"timestamps": [0.5, 1.0]
}
</plot>
<post_analysis>
{
"subject": "Mathematics",
"question_type": "Free Response",
"knowledge_point": [
"Mathematics",
"Algebra",
"Quadratic Inequalities"
]
}
</post_analysis>