QUESTION IMAGE
Question
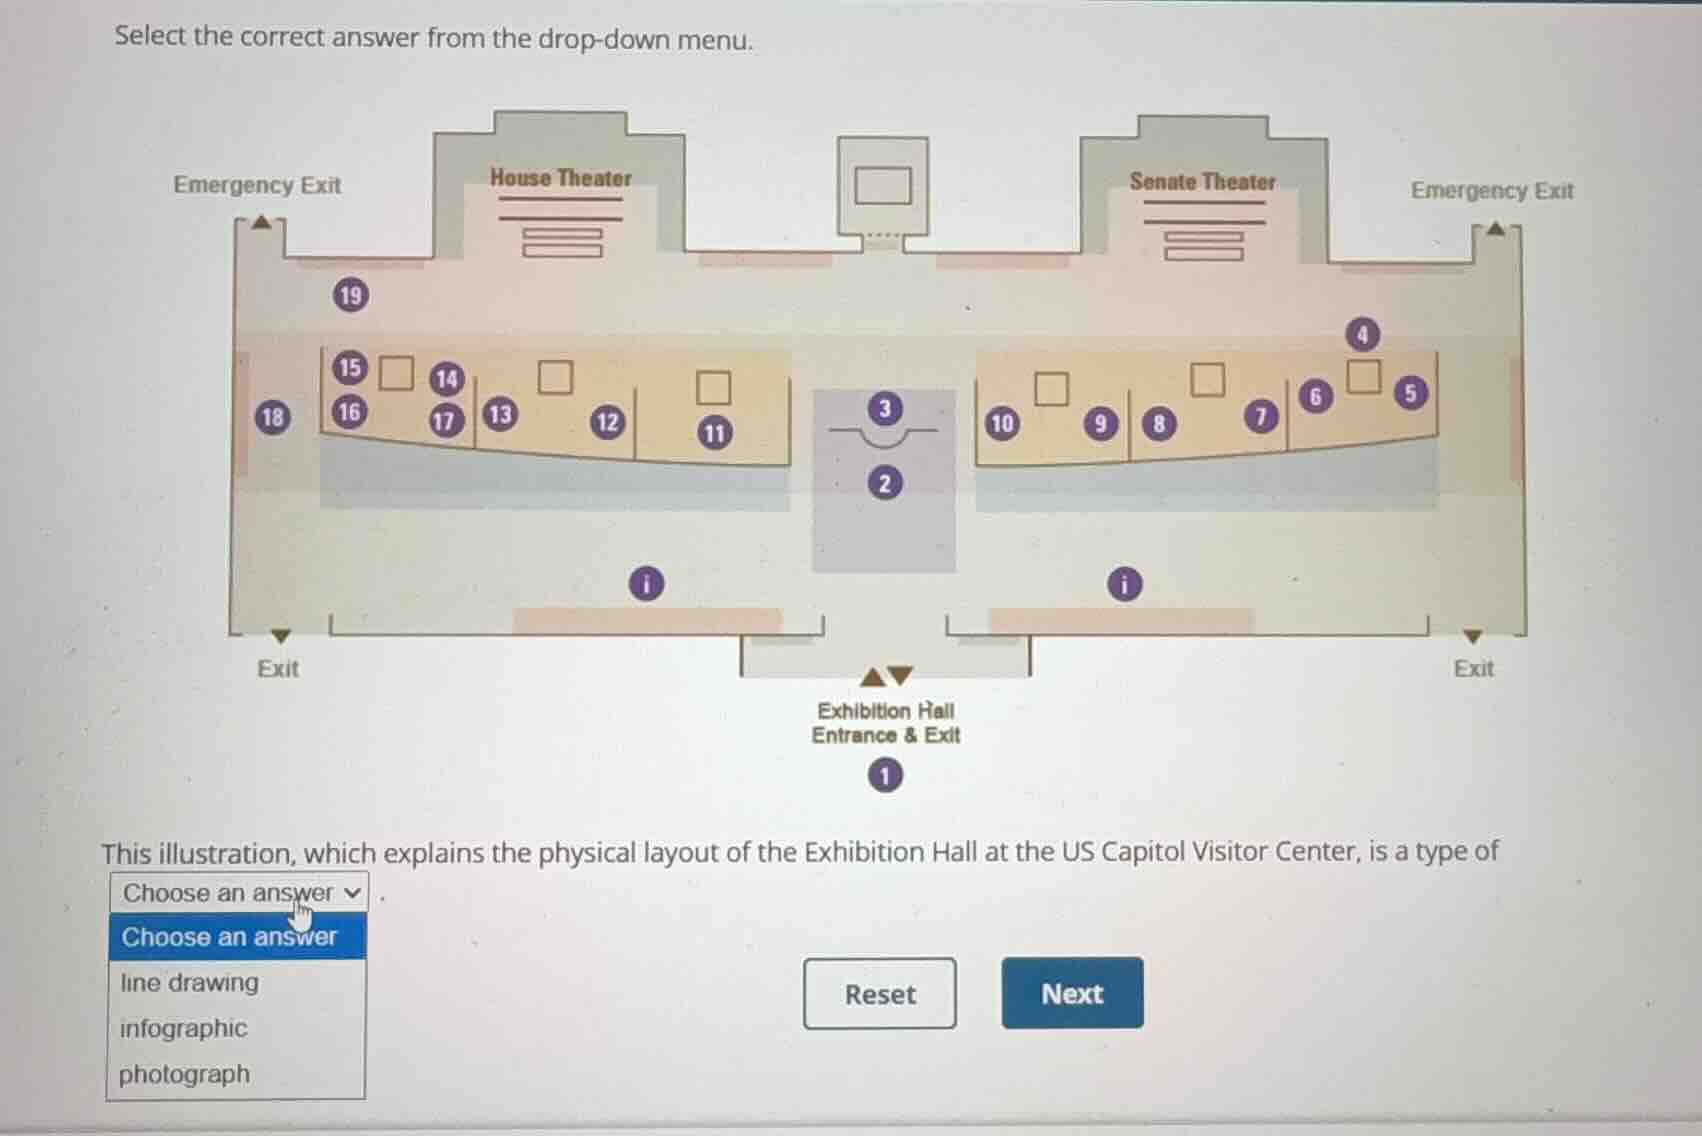
select the correct answer from the drop-down menu.
this illustration, which explains the physical layout of the exhibition hall at the us capitol visitor center, is a type of
choose an answer
line drawing
infographic
photograph
<pre_analysis>
{
"quality": "clear",
"question_count": 1,
"skills_matched": [
"direct_cot",
"multiple_choice_formatter",
"explain_then_answer",
"quick"
],
"needs_drawing": false,
"concepts_used": [
"Technical Document Types"
],
"new_concepts": [
"Visual Communication",
"Information Graphics"
],
"current_concepts": [
"Technical Document Types",
"Visual Communication",
"Information Graphics"
]
}
</pre_analysis>
<reasoning>
Analyze the visual characteristics of the illustration
The image shows a detailed map of the Exhibition Hall at the US Capitol Visitor Center. It includes labeled locations (such as "House Theater", "Senate Theater", "Emergency Exit"), numbered points of interest (1 through 19), and icons representing information desks and exits.
Compare with the given options
- line drawing: A simple drawing consisting only of lines without shading, color, or complex data integration. This illustration is much more complex, containing color fills, icons, and structured spatial data.
- infographic: A visual representation of information, data, or knowledge intended to present information quickly and clearly. A labeled map designed to explain a physical layout with numbered guides and icons fits this definition perfectly.
- photograph: An image created by light falling on a photosensitive surface (like film or an optical sensor). This is a digitally designed graphic, not a photograph.
</reasoning>
<answer>
<mcq-option>line drawing</mcq-option>
<mcq-correct>infographic</mcq-correct>
<mcq-option>photograph</mcq-option>
</answer>
<post_analysis>
{
"subject": "Others",
"question_type": "Multiple Choice",
"knowledge_point": [
"Others",
"Professional Communication",
"Visual Text Integration"
]
}
</post_analysis>

Snap & solve any problem in the app
Get step-by-step solutions on Sovi AI
Photo-based solutions with guided steps
Explore more problems and detailed explanations
<pre_analysis>
{
"quality": "clear",
"question_count": 1,
"skills_matched": [
"direct_cot",
"multiple_choice_formatter",
"explain_then_answer",
"quick"
],
"needs_drawing": false,
"concepts_used": [
"Technical Document Types"
],
"new_concepts": [
"Visual Communication",
"Information Graphics"
],
"current_concepts": [
"Technical Document Types",
"Visual Communication",
"Information Graphics"
]
}
</pre_analysis>
<reasoning>
Analyze the visual characteristics of the illustration
The image shows a detailed map of the Exhibition Hall at the US Capitol Visitor Center. It includes labeled locations (such as "House Theater", "Senate Theater", "Emergency Exit"), numbered points of interest (1 through 19), and icons representing information desks and exits.
Compare with the given options
- line drawing: A simple drawing consisting only of lines without shading, color, or complex data integration. This illustration is much more complex, containing color fills, icons, and structured spatial data.
- infographic: A visual representation of information, data, or knowledge intended to present information quickly and clearly. A labeled map designed to explain a physical layout with numbered guides and icons fits this definition perfectly.
- photograph: An image created by light falling on a photosensitive surface (like film or an optical sensor). This is a digitally designed graphic, not a photograph.
</reasoning>
<answer>
<mcq-option>line drawing</mcq-option>
<mcq-correct>infographic</mcq-correct>
<mcq-option>photograph</mcq-option>
</answer>
<post_analysis>
{
"subject": "Others",
"question_type": "Multiple Choice",
"knowledge_point": [
"Others",
"Professional Communication",
"Visual Text Integration"
]
}
</post_analysis>