QUESTION IMAGE
Question
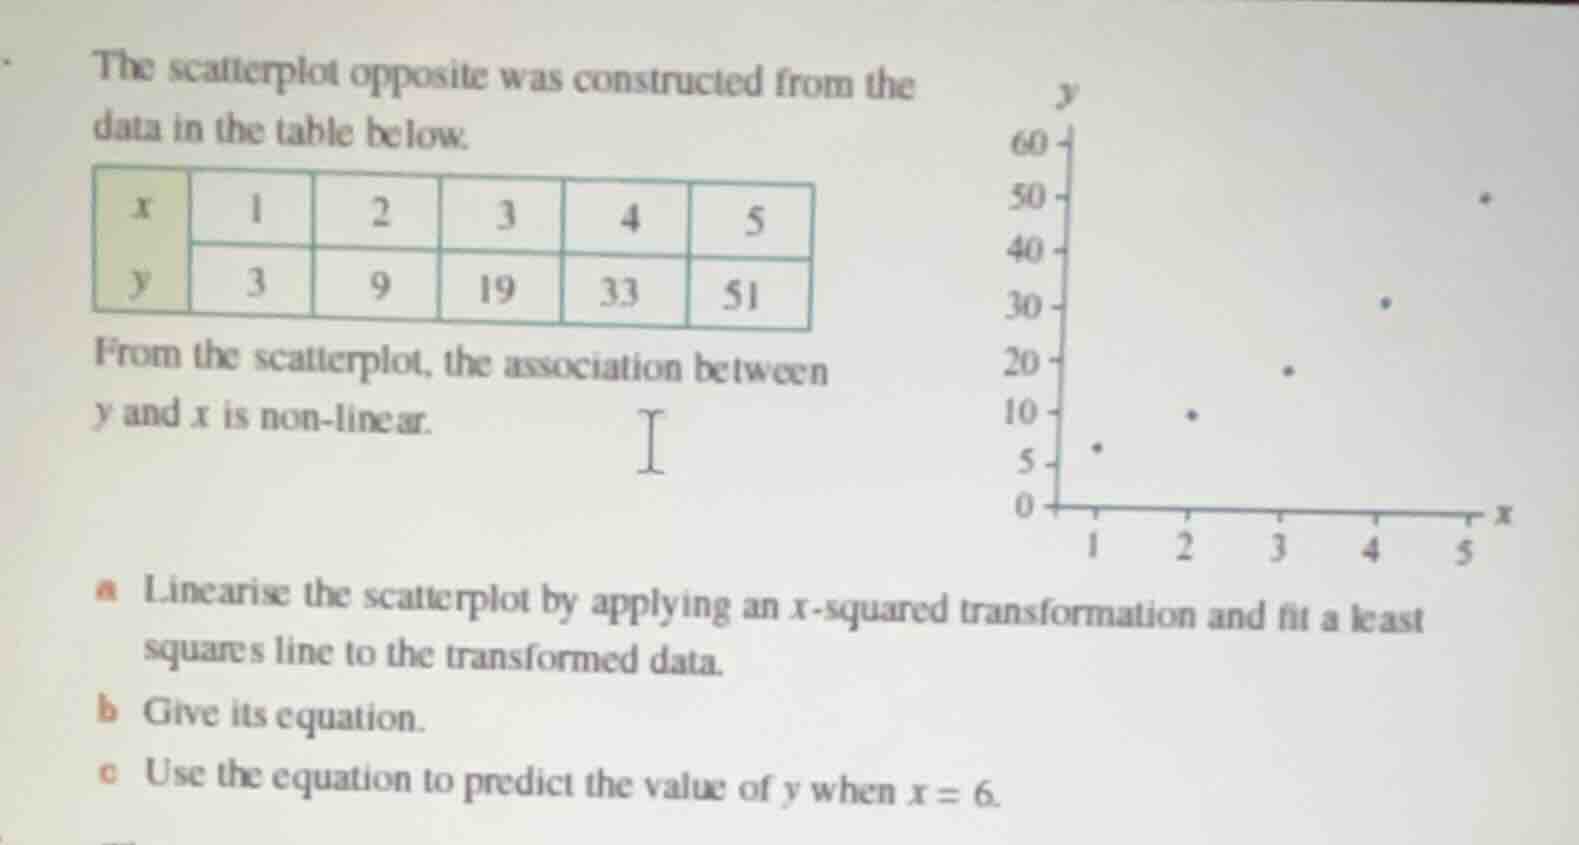
the scatterplot opposite was constructed from the data in the table below.
\
from the scatterplot, the association between \\(y\\) and \\(x\\) is non-linear.
a linearise the scatterplot by applying an \\(x\\)-squared transformation and fit a least squares line to the transformed data.
b give its equation.
c use the equation to predict the value of \\(y\\) when \\(x = 6\\).
🆕 New Concept Discovered: Data Linearisation
Transforming variables to fit a straight line
Step 1: Transform the independent variable
To linearise the data using an \( x^2 \) transformation, we square each of the original \( x \)-values to create a new independent variable, which we will call \( x^2 \).
The original data table is:
| \( x \) | 1 | 2 | 3 | 4 | 5 |
|---|
Squaring each \( x \)-value:
| \( x^2 \) | 1 | 4 | 9 | 16 | 25 |
|---|
Step 2: Fit a least-squares regression line
We find the equation of the least-squares regression line in the form:
\[ y = a + b(x^2) \]
First, calculate the summary statistics for the transformed variable \( X = x^2 \) and \( y \):
- Number of data points \( n = 5 \)
- Mean of \( X \):
\[ \bar{X} = \frac{1 + 4 + 9 + 16 + 25}{5} = \frac{55}{5} = 11 \]
- Mean of \( y \):
\[ \bar{y} = \frac{3 + 9 + 19 + 33 + 51}{5} = \frac{115}{5} = 23 \]
Next, calculate the slope \( b \):
\[ b = \frac{\sum (X_i - \bar{X})(y_i - \bar{y})}{\sum (X_i - \bar{X})^2} \]
Let's find the individual deviations and products:
| \( X_i \) | \( y_i \) | \( X_i - \bar{X} \) | \( y_i - \bar{y} \) | \( (X_i - \bar{X})(y_i - \bar{y}) \) | \( (X_i - \bar{X})^2 \) |
|---|---|---|---|---|---|
| 4 | 9 | -7 | -14 | 98 | 49 |
| 9 | 19 | -2 | -4 | 8 | 4 |
| 16 | 33 | 5 | 10 | 50 | 25 |
| 25 | 51 | 14 | 28 | 392 | 196 |
| Sum | 748 | 374 |
Calculate the slope \( b \):
\[ b = \frac{748}{374} = 2 \]
Calculate the intercept \( a \):
\[ a = \bar{y} - b\bar{X} = 23 - 2(11) = 23 - 22 = 1 \]
The equation of the least-squares regression line is:
\[ y = 1 + 2x^2 \]
Step 3: Predict the value of \( y \) when \( x = 6 \)
Substitute \( x = 6 \) into the transformed equation:
\[ y = 1 + 2(6)^2 \]
\[ y = 1 + 2(36) \]
\[ y = 1 + 72 = 73 \]

Snap & solve any problem in the app
Get step-by-step solutions on Sovi AI
Photo-based solutions with guided steps
Explore more problems and detailed explanations
a The transformed data table is:
| \( x^2 \) | 1 | 4 | 9 | 16 | 25 |
|---|
b The equation of the least-squares line is:
\[ y = 1 + 2x^2 \]
c When \( x = 6 \):
\[ y = 73 \]