QUESTION IMAGE
Question
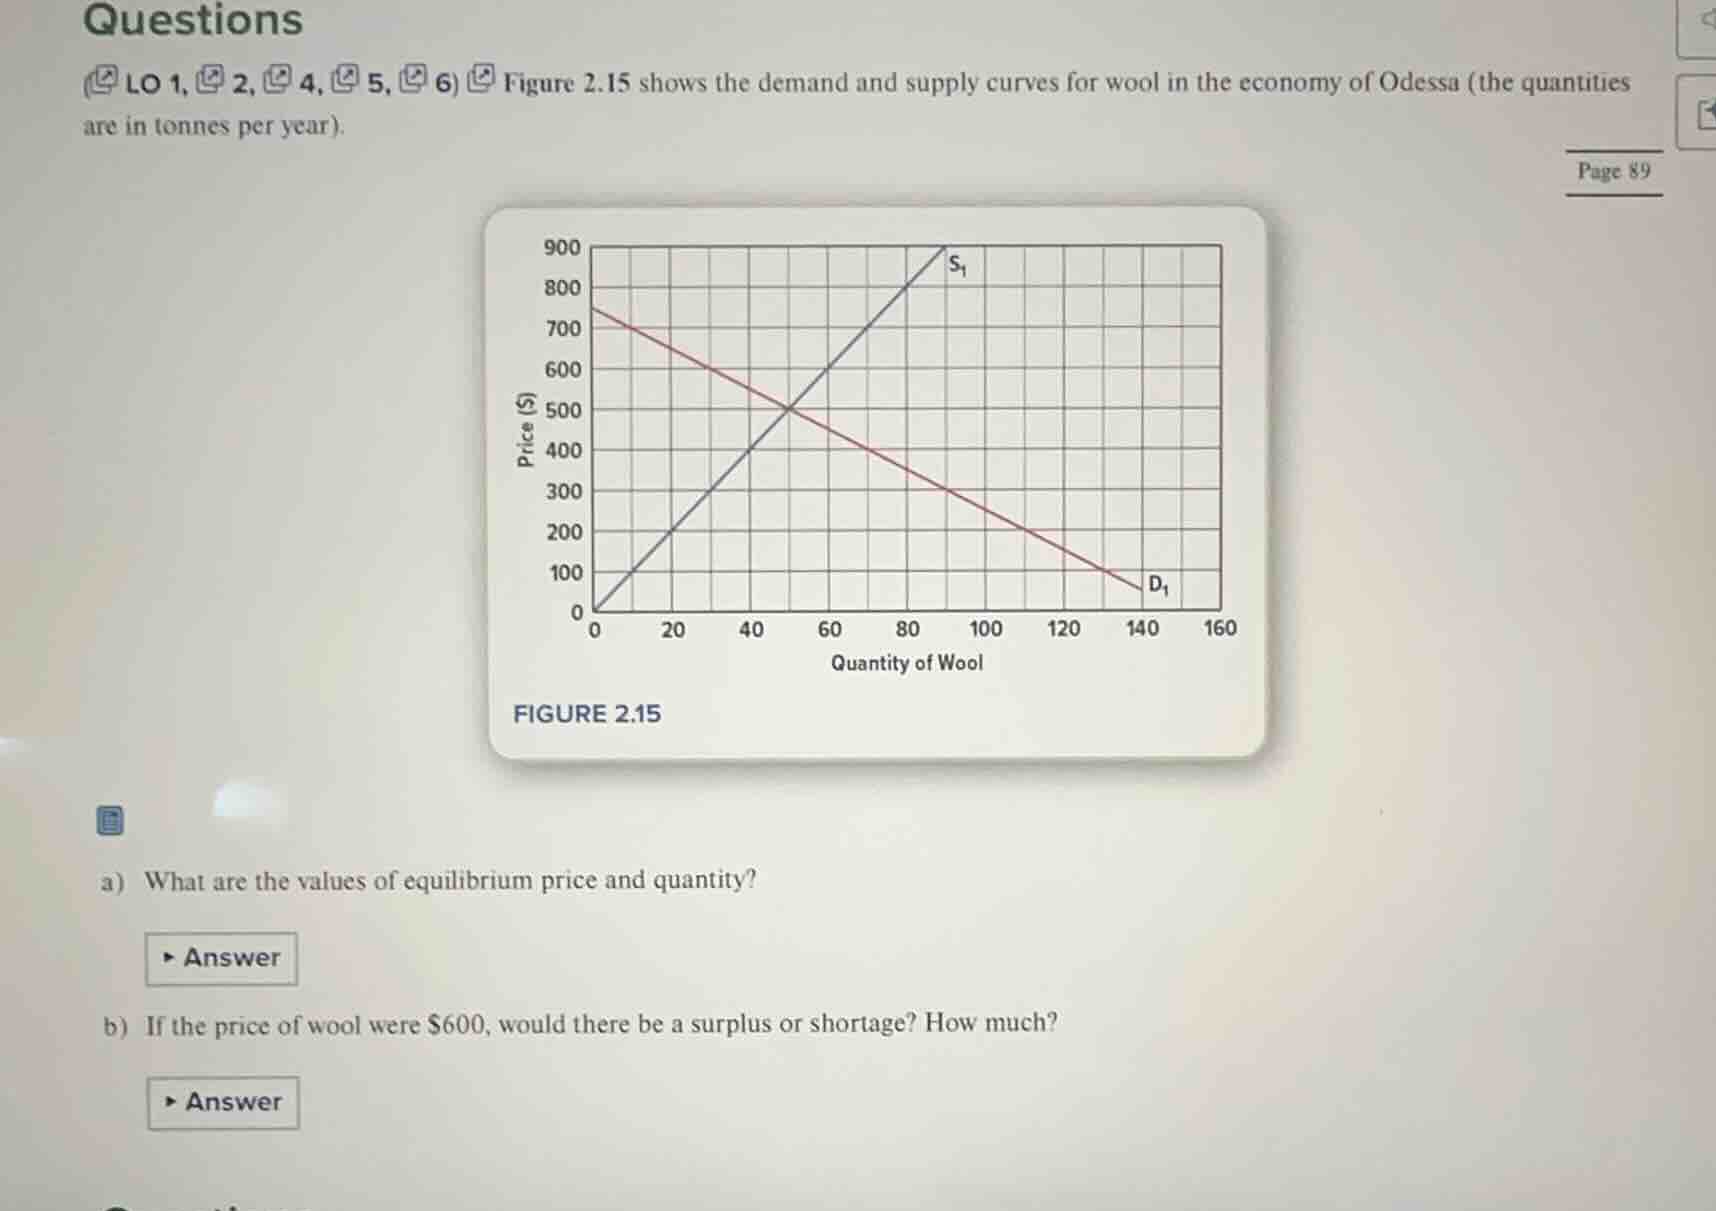
questions (lo 1, 2, 4, 5, 6) figure 2.15 shows the demand and supply curves for wool in the economy of odessa (the quantities are in tonnes per year).
figure 2.15
a) what are the values of equilibrium price and quantity?
b) if the price of wool were $600, would there be a surplus or shortage? how much?
Part (a)
Step1: Identify Equilibrium Point
The equilibrium in a supply - demand graph is where the demand curve (\(D_1\)) and supply curve (\(S_1\)) intersect. From the graph, we look for the point where the two curves cross each other.
Step2: Read Coordinates of Intersection
Looking at the graph, the intersection point of the demand and supply curves has a price (y - axis) of \(\$500\) and a quantity (x - axis) of \(50\) tonnes per year.
Step1: Find Quantity Demanded at \(\$600\)
On the demand curve (\(D_1\)), when the price is \(\$600\), we find the corresponding quantity demanded. From the graph, we can see that at a price of \(\$600\), the quantity demanded (\(Q_d\)) is \(40\) tonnes (by looking at the x - value on the demand curve at \(y = 600\)).
Step2: Find Quantity Supplied at \(\$600\)
On the supply curve (\(S_1\)), when the price is \(\$600\), we find the corresponding quantity supplied. From the graph, at a price of \(\$600\), the quantity supplied (\(Q_s\)) is \(60\) tonnes (by looking at the x - value on the supply curve at \(y = 600\)).
Step3: Determine Surplus/Shortage and Calculate Magnitude
Since \(Q_s>Q_d\) ( \(60>40\) ), there is a surplus. The magnitude of the surplus is \(Q_s - Q_d=60 - 40 = 20\) tonnes.

Snap & solve any problem in the app
Get step-by-step solutions on Sovi AI
Photo-based solutions with guided steps
Explore more problems and detailed explanations
The equilibrium price is \(\$500\) per tonne and the equilibrium quantity is \(50\) tonnes per year.