QUESTION IMAGE
Question
question 2
6 pts
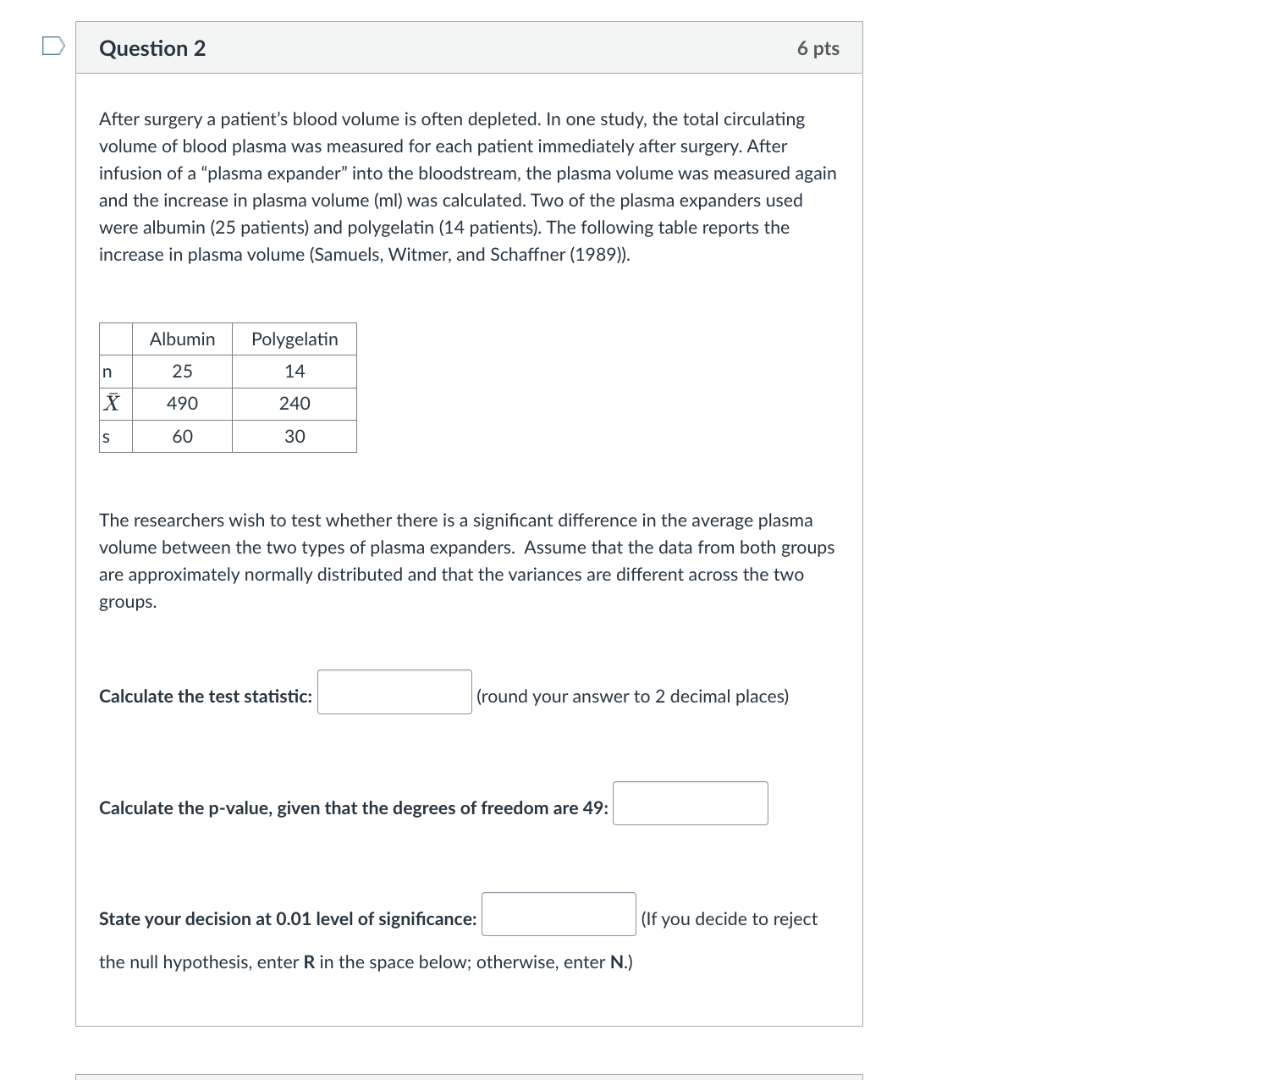
after surgery a patients blood volume is often depleted. in one study, the total circulating volume of blood plasma was measured for each patient immediately after surgery. after infusion of a \plasma expander\ into the bloodstream, the plasma volume was measured again and the increase in plasma volume (ml) was calculated. two of the plasma expanders used were albumin (25 patients) and polygelatin (14 patients). the following table reports the increase in plasma volume (samuels, witmer, and schaffner (1989)).
\
the researchers wish to test whether there is a significant difference in the average plasma volume between the two types of plasma expanders. assume that the data from both groups are approximately normally distributed and that the variances are different across the two groups.
calculate the test statistic: (round your answer to 2 decimal places)
calculate the p-value, given that the degrees of freedom are 49:
state your decision at 0.01 level of significance: (if you decide to reject the null hypothesis, enter r in the space below; otherwise, enter n.)
⚡ Using what you learned: Hypothesis Testing · 🆕 New: Two-Sample t-Test (Unequal Variances)
Comparing two independent group means
Step 1: Identify the given values
From the problem description and table:
- Group 1 (Albumin):
- \( n_1 = 25 \)
- \( \bar{X}_1 = 490 \)
- \( s_1 = 60 \)
- Group 2 (Polygelatin):
- \( n_2 = 14 \)
- \( \bar{X}_2 = 240 \)
- \( s_2 = 30 \)
We want to test if there is a significant difference in the average plasma volume between the two groups (a two-tailed test):
- \( H_0: \mu_1 - \mu_2 = 0 \)
- \( H_a: \mu_1 - \mu_2
eq 0 \)
Step 2: Calculate the test statistic
Since the variances are assumed to be unequal, we use the two-sample \( t \)-test with unequal variances (Welch's \( t \)-test):
\[ t = \frac{\bar{X}_1 - \bar{X}_2}{\sqrt{\frac{s_1^2}{n_1} + \frac{s_2^2}{n_2}}} \]
Substitute the values:
\[ t = \frac{490 - 240}{\sqrt{\frac{60^2}{25} + \frac{30^2}{14}}} \]
\[ t = \frac{250}{\sqrt{\frac{3600}{25} + \frac{900}{14}}} \]
\[ t = \frac{250}{\sqrt{144 + 64.2857}} \]
\[ t = \frac{250}{\sqrt{208.2857}} \]
\[ t = \frac{250}{14.4321} \approx 17.3225 \]
Rounding to 2 decimal places:
\[ t \approx 17.32 \]
Step 3: Calculate the p-value
We are given that the degrees of freedom (\( df \)) are \( 49 \).
Since this is a two-tailed test, the \( p \)-value is:
\[ p\text{-value} = 2 \times P(T > 17.32) \]
For a \( t \)-distribution with \( df = 49 \), a \( t \)-score of \( 17.32 \) is extremely far into the tail. The probability of obtaining a value this extreme is virtually zero.
\[ p\text{-value} \approx 0.0000 \]
Rounding to 4 decimal places (or standard scientific notation):
\[ p\text{-value} < 0.0001 \text{ (or simply } 0\text{)} \]
Step 4: State the decision at the 0.01 level of significance
We compare the \( p \)-value to the significance level \( \alpha = 0.01 \):
- Since \( p\text{-value} \approx 0 < 0.01 \), we reject the null hypothesis \( H_0 \).
Therefore, the decision is to reject, which corresponds to R.

Snap & solve any problem in the app
Get step-by-step solutions on Sovi AI
Photo-based solutions with guided steps
Explore more problems and detailed explanations
- Calculate the test statistic: 17.32
- Calculate the p-value, given that the degrees of freedom are 49: 0.0000 (or <0.0001)
- State your decision at 0.01 level of significance: R