QUESTION IMAGE
Question
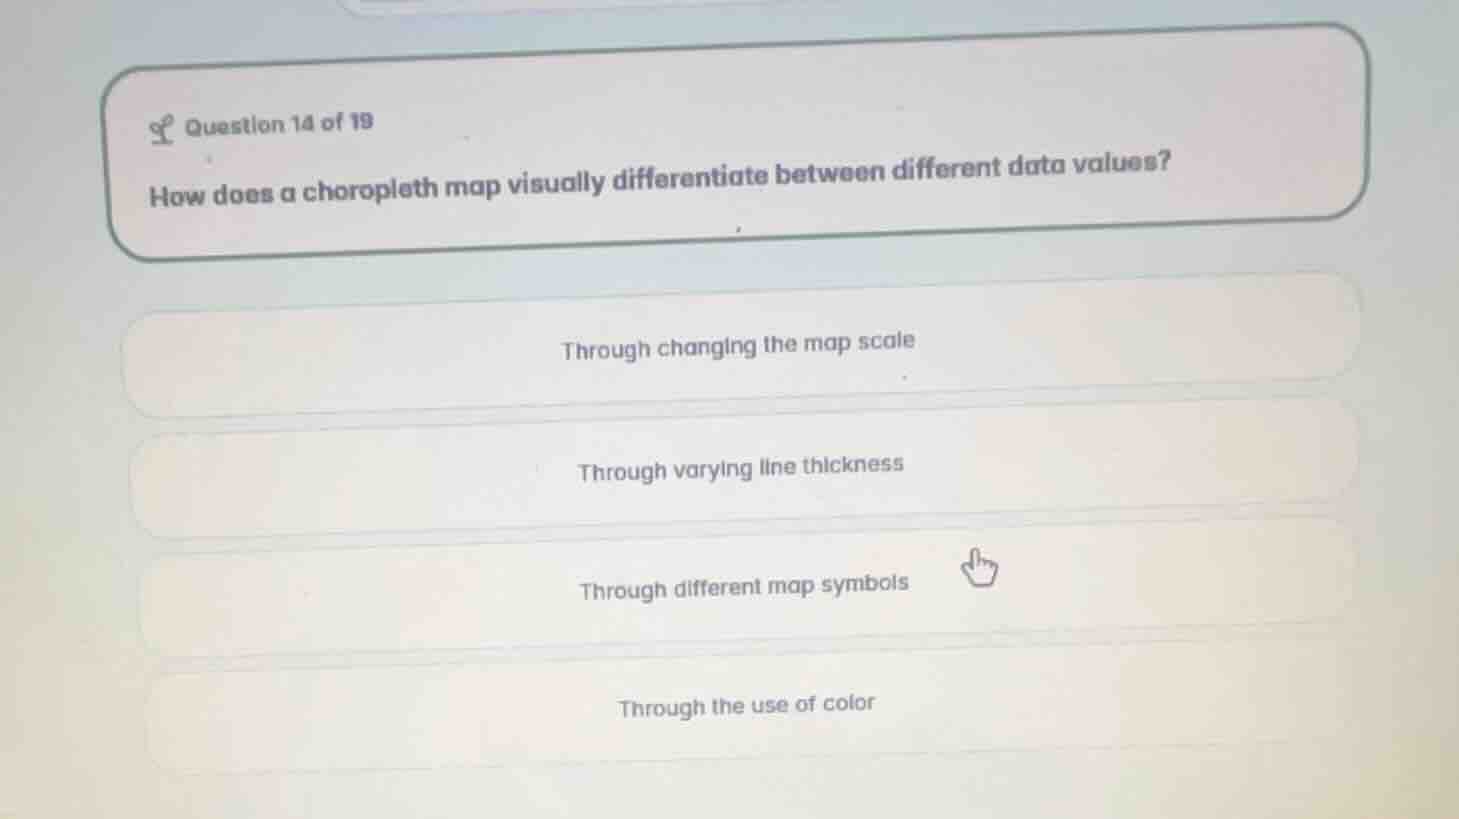
question 14 of 19
how does a choropleth map visually differentiate between different data values?
through changing the map scale
through varying line thickness
through different map symbols
through the use of color
Define choropleth map characteristics
A choropleth map is a thematic map where areas are shaded, colored, or patterned in proportion to a statistical variable.
Evaluate the given options
- "Through changing the map scale": Map scale determines the ratio of distance on the map to distance on the ground, not data values.
- "Through varying line thickness": Line thickness is typically used in flow maps or isoline maps.
- "Through different map symbols": Symbols are used in dot distribution or proportional symbol maps.
- "Through the use of color": Choropleth maps use color shading, hues, or intensities to represent different data values.

Snap & solve any problem in the app
Get step-by-step solutions on Sovi AI
Photo-based solutions with guided steps
Explore more problems and detailed explanations
- Through changing the map scale
- Through varying line thickness
- Through different map symbols
- Through the use of color (Correct answer)