QUESTION IMAGE
Question
put the states in order from lowest percentage of foreign-born residents to highest percentage of foreign-born residents.
start by choosing the first item in the sequence and clicking, dragging, or using your keyboard to select it.
drag the items below into the box above in the correct order, starting with the first item in the sequence.
pennsylvania, new york, alabama, texas
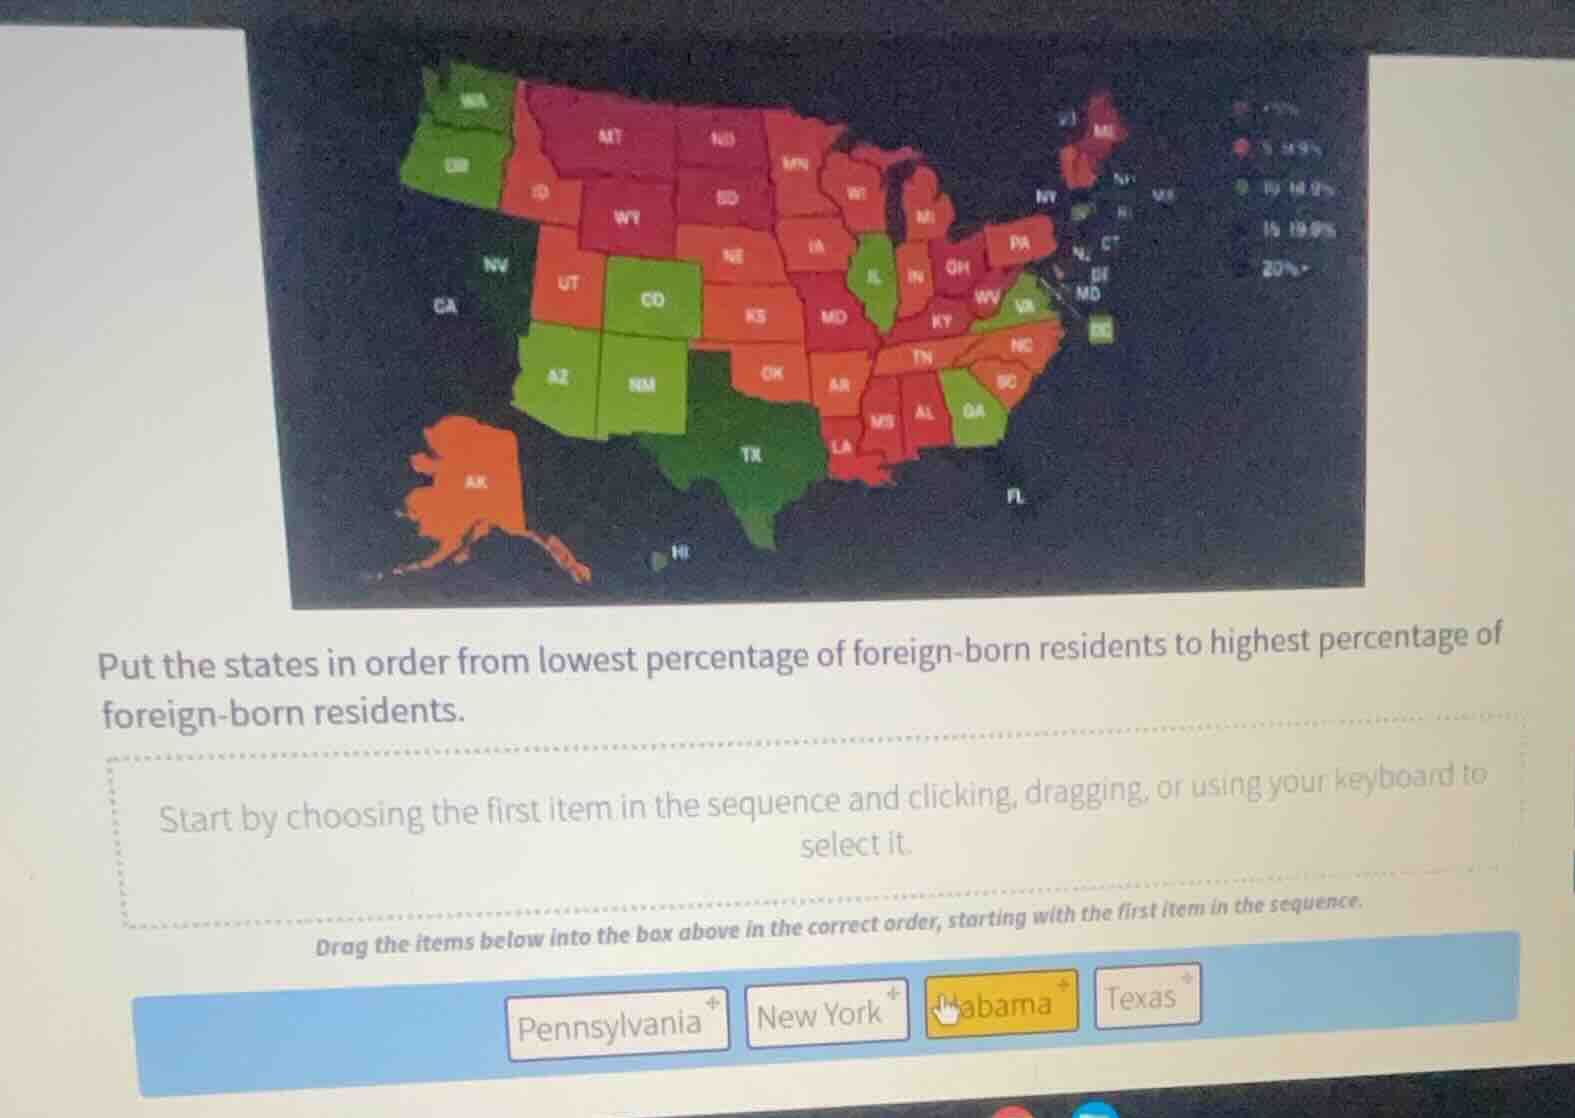
Analyze the map legend and state colors
The map categorizes states by the percentage of foreign-born residents:
- Red/Orange shades (e.g., Alabama): Lowest percentages (\(< 5\%\) or \(5 - 9.9\%\))
- Light Green/Medium Green shades (e.g., Pennsylvania): Intermediate percentages (\(10 - 14.9\%\))
- Dark Green/Teal shades (e.g., Texas, New York): Highest percentages (\(15 - 19.9\%\) or \(20\%+\))
Identify the specific values for the given states
- Alabama (AL): Colored red, representing the lowest category (\(< 5\%\)).
- Pennsylvania (PA): Colored orange-red/light orange, representing a low-to-intermediate category (\(5 - 9.9\%\)).
- Texas (TX): Colored dark green, representing a high category (\(15 - 19.9\%\)).
- New York (NY): Colored dark teal/blue-green, representing the highest category (\(20\%+\)).
Order the states from lowest to highest percentage
Comparing the categories:
- Alabama (lowest)
- Pennsylvania
- Texas
- New York (highest)

Snap & solve any problem in the app
Get step-by-step solutions on Sovi AI
Photo-based solutions with guided steps
Explore more problems and detailed explanations
- Alabama
- Pennsylvania
- Texas
- New York