QUESTION IMAGE
Question
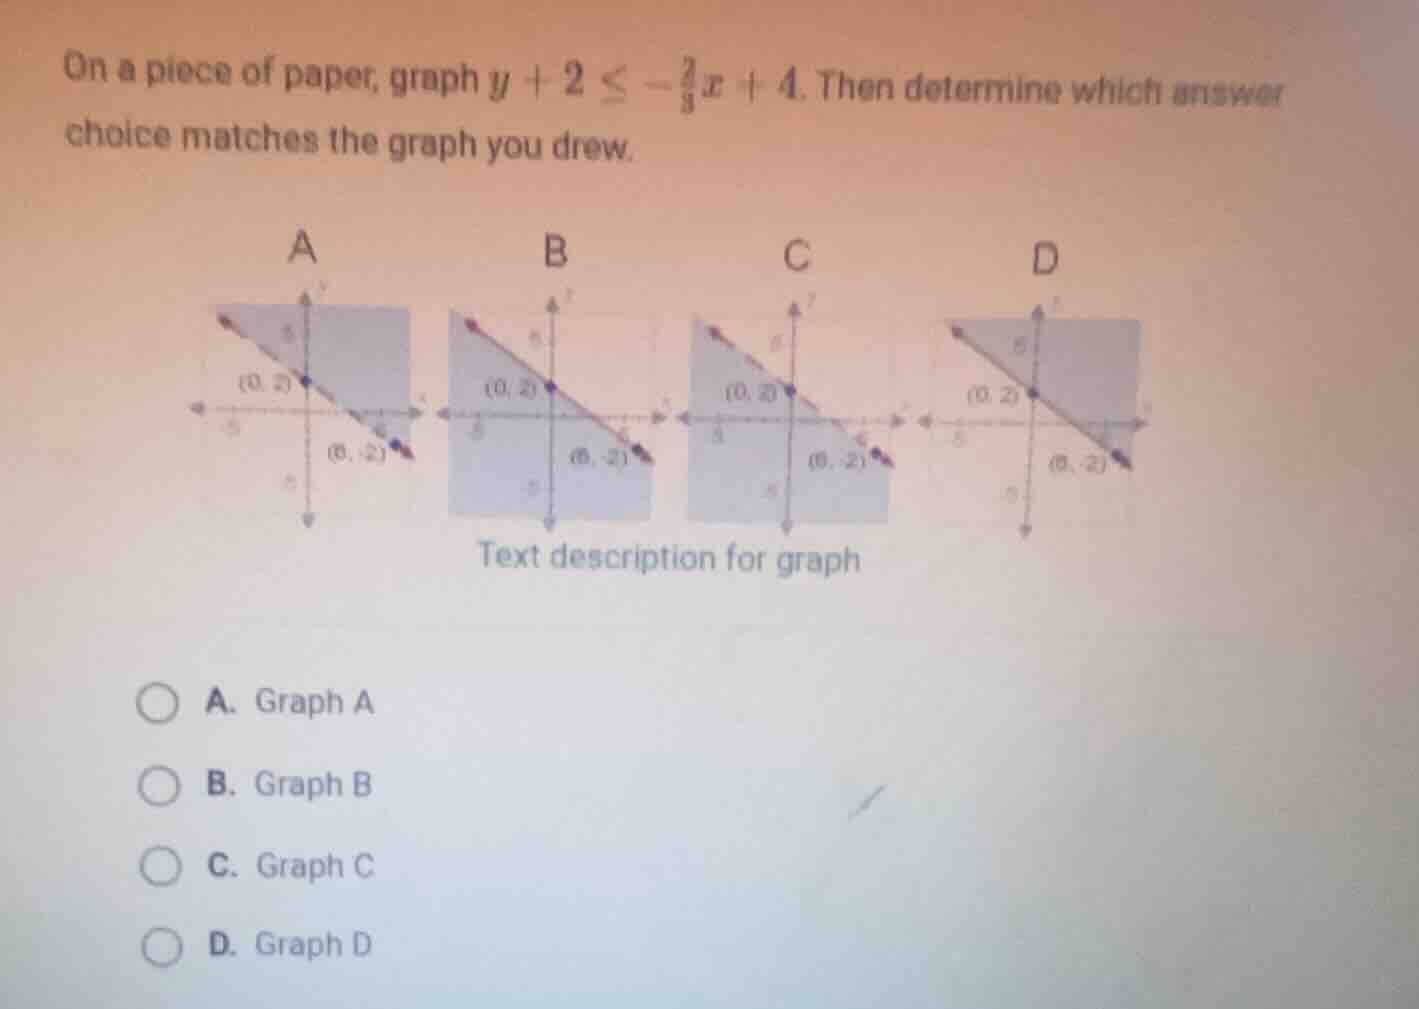
on a piece of paper, graph \\(y + 2 \le -\frac{2}{3}x + 4\\). then determine which answer choice matches the graph you drew.
a. graph a
b. graph b
c. graph c
d. graph d
<pre_analysis>
{
"quality": "clear",
"question_count": 1,
"skills_matched": [
"step_cot",
"multiple_choice_formatter",
"explain_then_answer",
"quick",
"mastery_adaptive_brevity"
],
"needs_drawing": true,
"concepts_used": [],
"new_concepts": [],
"current_concepts": [
"Graphing Inequalities",
"Slope-Intercept Form",
"Shading Half-Planes",
"Evaluating Inequalities"
]
}
</pre_analysis>
<reasoning>
Rearrange the inequality to slope-intercept form
\[
\]
Identify boundary line properties
- Slope: \(m = -\frac{2}{3}\)
- y-intercept: \((0, 2)\)
- x-intercept: Set \(y = 0 \implies 0 = -\frac{2}{3}x + 2 \implies x = 3\), so \((3, 0)\). The graphs show points \((0, 2)\) and \((6, -2)\). Checking \((6, -2)\): \(-2 = -\frac{2}{3}(6) + 2 = -4 + 2 = -2\) (correct).
- Inequality symbol is \(\le\), which means a solid boundary line. This eliminates Graphs C and D (dashed lines).
Determine the shaded region
- Test point \((0,0)\):
\[
0 \le -\frac{2}{3}(0) + 2 \implies 0 \le 2 \quad (\text{True})
\]
- Since the inequality is true at \((0,0)\), shade the half-plane containing the origin (below and to the left of the line).
- Graph A shades the region above/right of the line.
- Graph B shades the region below/left of the line (containing the origin).
- Therefore, Graph B is the correct match.
</reasoning>
<answer>
<mcq-correct>A. Graph A</mcq-correct>
<mcq-option>B. Graph B</mcq-option>
<mcq-option>C. Graph C</mcq-option>
<mcq-option>D. Graph D</mcq-option>
</answer>
<plot>
{
"elements": [
{
"type": "inequality",
"params": [
{
"js": "-2/3*x + 2",
"latex": "y \le -\frac{2}{3}x + 2"
},
[0, 0]
],
"properties": {
"inverse": false,
"strict": false,
"fillColor": "rgba(140, 85, 242, 0.3)",
"strokeColor": "#8C55F2",
"strokeWidth": 3
}
},
{
"type": "point",
"params": [[0, 2]],
"properties": {
"name": "(0, 2)",
"size": 4,
"color": "#583C87",
"withLabel": true
}
},
{
"type": "point",
"params": [[6, -2]],
"properties": {
"name": "(6, -2)",
"size": 4,
"color": "#583C87",
"withLabel": true
}
}
],
"timestamps": [0.5, 1.0]
}
</plot>
<post_analysis>
{
"subject": "Mathematics",
"question_type": "Multiple Choice",
"knowledge_point": [
"Mathematics",
"Algebra",
"Graphing Inequalities"
]
}
</post_analysis>

Snap & solve any problem in the app
Get step-by-step solutions on Sovi AI
Photo-based solutions with guided steps
Explore more problems and detailed explanations
<pre_analysis>
{
"quality": "clear",
"question_count": 1,
"skills_matched": [
"step_cot",
"multiple_choice_formatter",
"explain_then_answer",
"quick",
"mastery_adaptive_brevity"
],
"needs_drawing": true,
"concepts_used": [],
"new_concepts": [],
"current_concepts": [
"Graphing Inequalities",
"Slope-Intercept Form",
"Shading Half-Planes",
"Evaluating Inequalities"
]
}
</pre_analysis>
<reasoning>
Rearrange the inequality to slope-intercept form
\[
\]
Identify boundary line properties
- Slope: \(m = -\frac{2}{3}\)
- y-intercept: \((0, 2)\)
- x-intercept: Set \(y = 0 \implies 0 = -\frac{2}{3}x + 2 \implies x = 3\), so \((3, 0)\). The graphs show points \((0, 2)\) and \((6, -2)\). Checking \((6, -2)\): \(-2 = -\frac{2}{3}(6) + 2 = -4 + 2 = -2\) (correct).
- Inequality symbol is \(\le\), which means a solid boundary line. This eliminates Graphs C and D (dashed lines).
Determine the shaded region
- Test point \((0,0)\):
\[
0 \le -\frac{2}{3}(0) + 2 \implies 0 \le 2 \quad (\text{True})
\]
- Since the inequality is true at \((0,0)\), shade the half-plane containing the origin (below and to the left of the line).
- Graph A shades the region above/right of the line.
- Graph B shades the region below/left of the line (containing the origin).
- Therefore, Graph B is the correct match.
</reasoning>
<answer>
<mcq-correct>A. Graph A</mcq-correct>
<mcq-option>B. Graph B</mcq-option>
<mcq-option>C. Graph C</mcq-option>
<mcq-option>D. Graph D</mcq-option>
</answer>
<plot>
{
"elements": [
{
"type": "inequality",
"params": [
{
"js": "-2/3*x + 2",
"latex": "y \le -\frac{2}{3}x + 2"
},
[0, 0]
],
"properties": {
"inverse": false,
"strict": false,
"fillColor": "rgba(140, 85, 242, 0.3)",
"strokeColor": "#8C55F2",
"strokeWidth": 3
}
},
{
"type": "point",
"params": [[0, 2]],
"properties": {
"name": "(0, 2)",
"size": 4,
"color": "#583C87",
"withLabel": true
}
},
{
"type": "point",
"params": [[6, -2]],
"properties": {
"name": "(6, -2)",
"size": 4,
"color": "#583C87",
"withLabel": true
}
}
],
"timestamps": [0.5, 1.0]
}
</plot>
<post_analysis>
{
"subject": "Mathematics",
"question_type": "Multiple Choice",
"knowledge_point": [
"Mathematics",
"Algebra",
"Graphing Inequalities"
]
}
</post_analysis>