QUESTION IMAGE
Question
a paragliding company in switzerland recorded the number of hundreds of people that have signed up to go paragliding on their website for the past 50 days (pulling data on each 10th day).
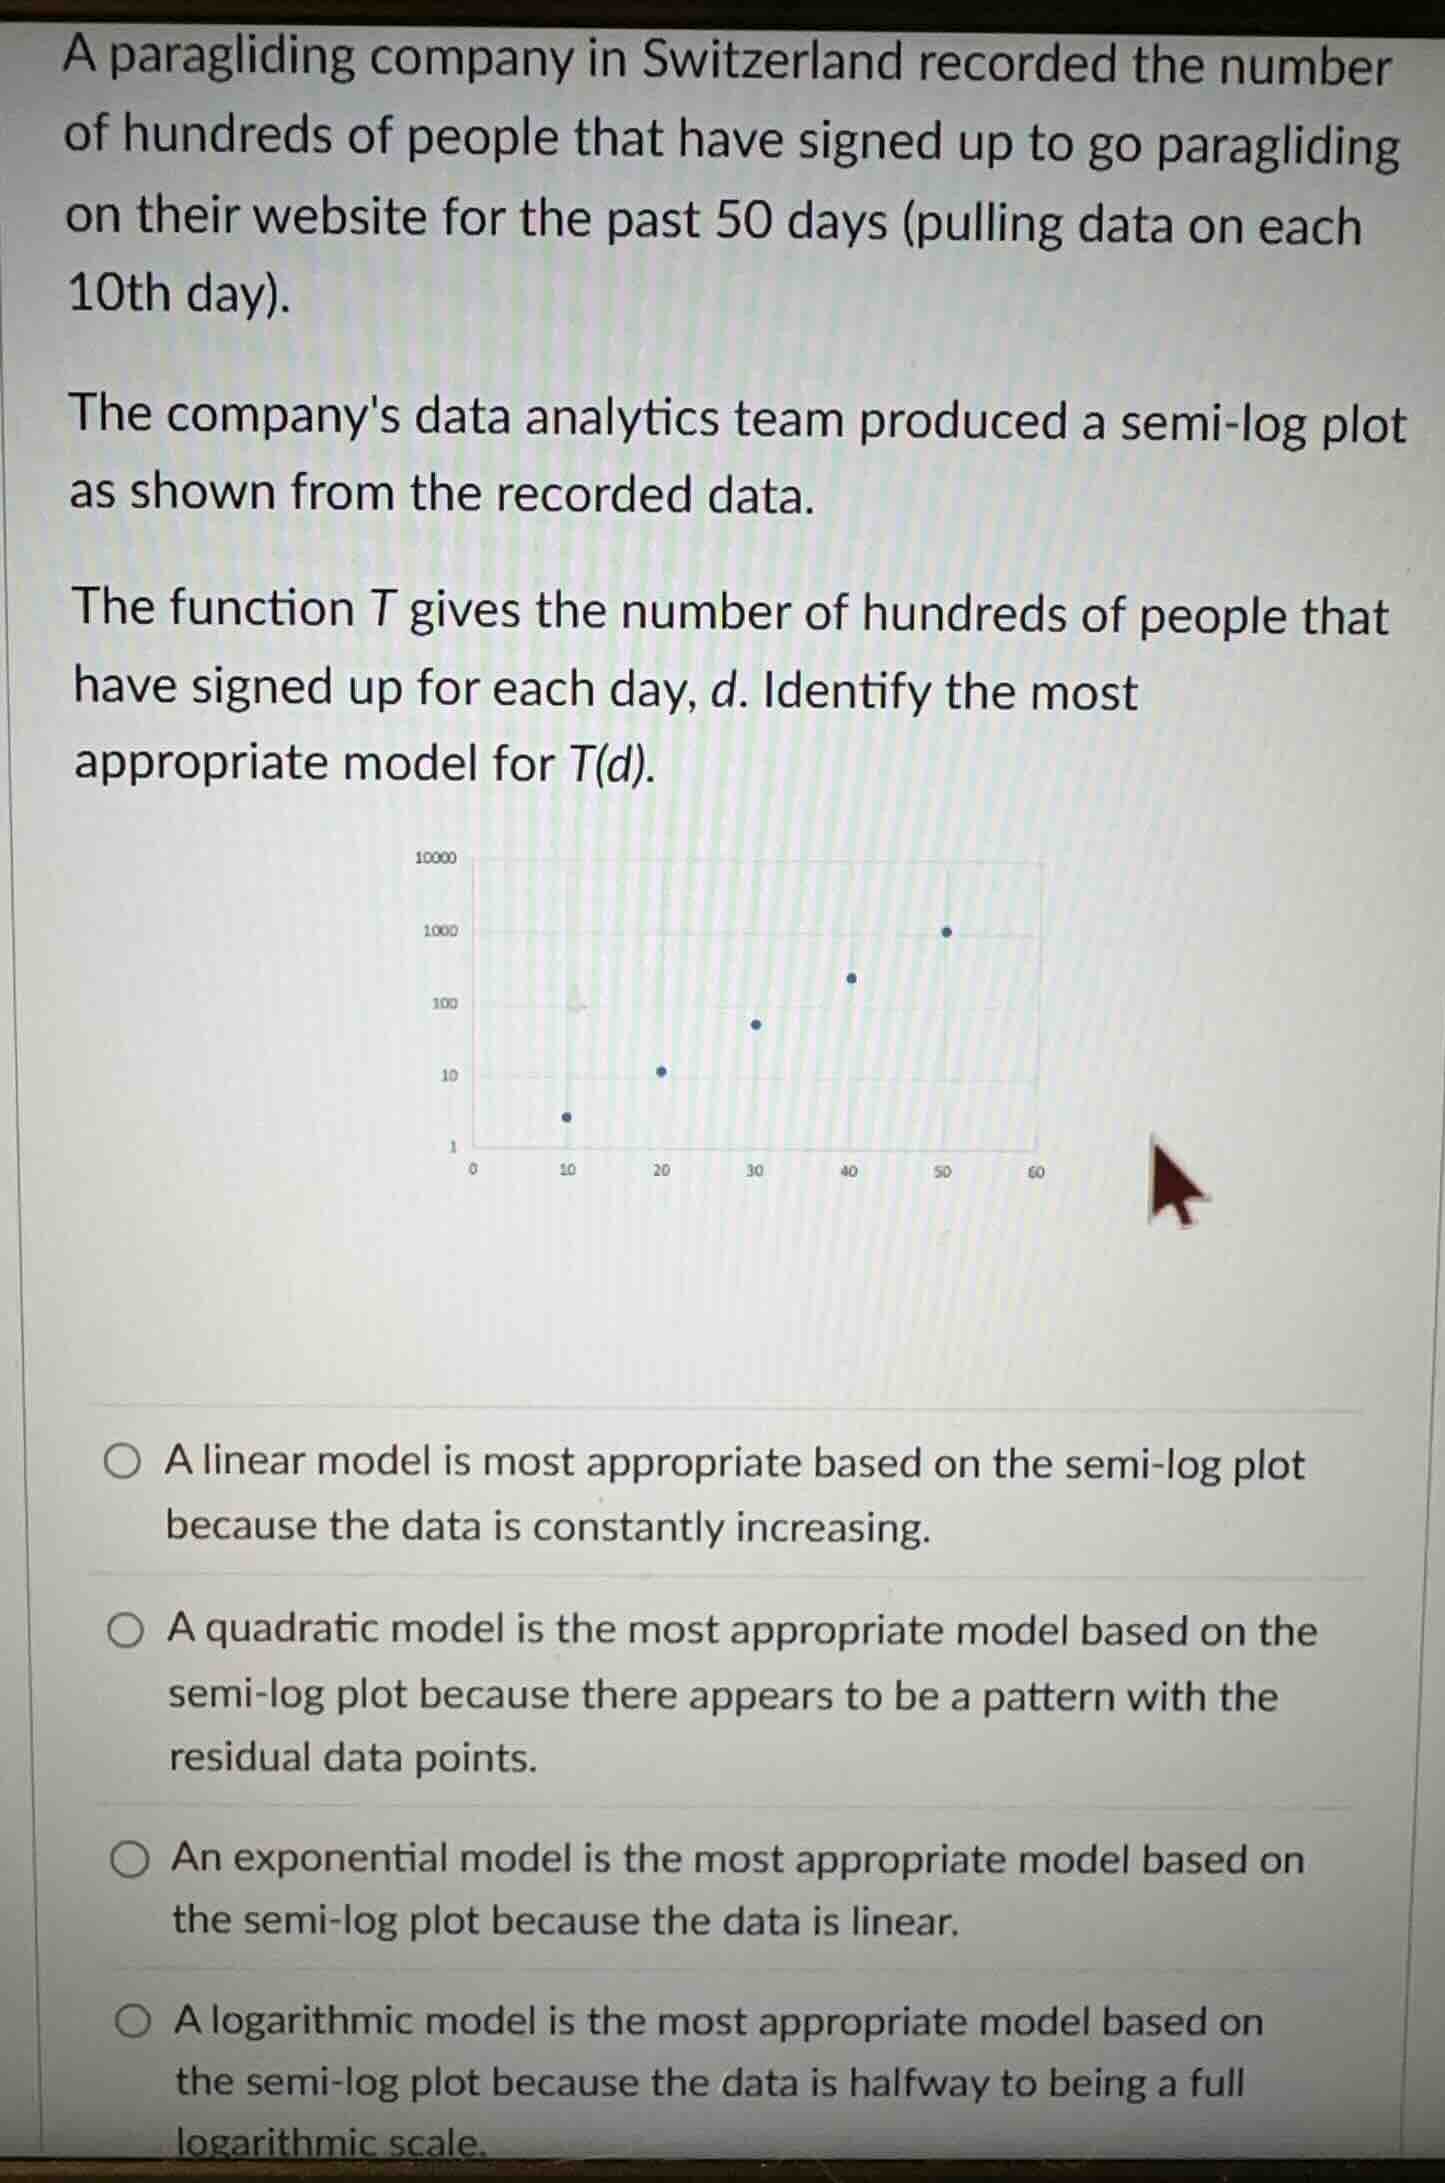
the companys data analytics team produced a semi-log plot as shown from the recorded data.
the function (t) gives the number of hundreds of people that have signed up for each day, (d). identify the most appropriate model for (t(d)).
- a linear model is most appropriate based on the semi-log plot because the data is constantly increasing.
- a quadratic model is most appropriate model based on the semi-log plot because there appears to be a pattern with the residual data points.
- an exponential model is most appropriate model based on the semi-log plot because the data is linear.
- a logarithmic model is most appropriate based on the semi-log plot because the data is halfway to being a full logarithmic scale.
🆕 New Concept Discovered: Semi-Log Plots and Exponential Models
Linear patterns on a logarithmic scale mean exponential growth.
Step 1: Analyze the axes of the semi-log plot
In a semi-log plot, one axis (the horizontal axis, \(d\)) uses a standard linear scale, while the other axis (the vertical axis, \(T(d)\)) uses a logarithmic scale (powers of 10: 1, 10, 100, 1000, 10000).
Step 2: Observe the pattern of the plotted data
The plotted points on this semi-log graph lie approximately along a straight line.
Step 3: Relate a linear pattern on a semi-log plot to the original function
When data plotted on a semi-log plot (where the vertical axis is \(\log(y)\) and the horizontal axis is \(x\)) forms a straight line, it indicates a linear relationship between \(\log(y)\) and \(x\):
Converting this back to the original variables by exponentiating both sides:
This is the definition of an exponential model, \(y = a \cdot c^x\). Therefore, because the data points appear linear on the semi-log plot, an exponential model is the most appropriate model for the original data \(T(d)\).

Snap & solve any problem in the app
Get step-by-step solutions on Sovi AI
Photo-based solutions with guided steps
Explore more problems and detailed explanations
An exponential model is the most appropriate model based on the semi-log plot because the data is linear.