QUESTION IMAGE
Question
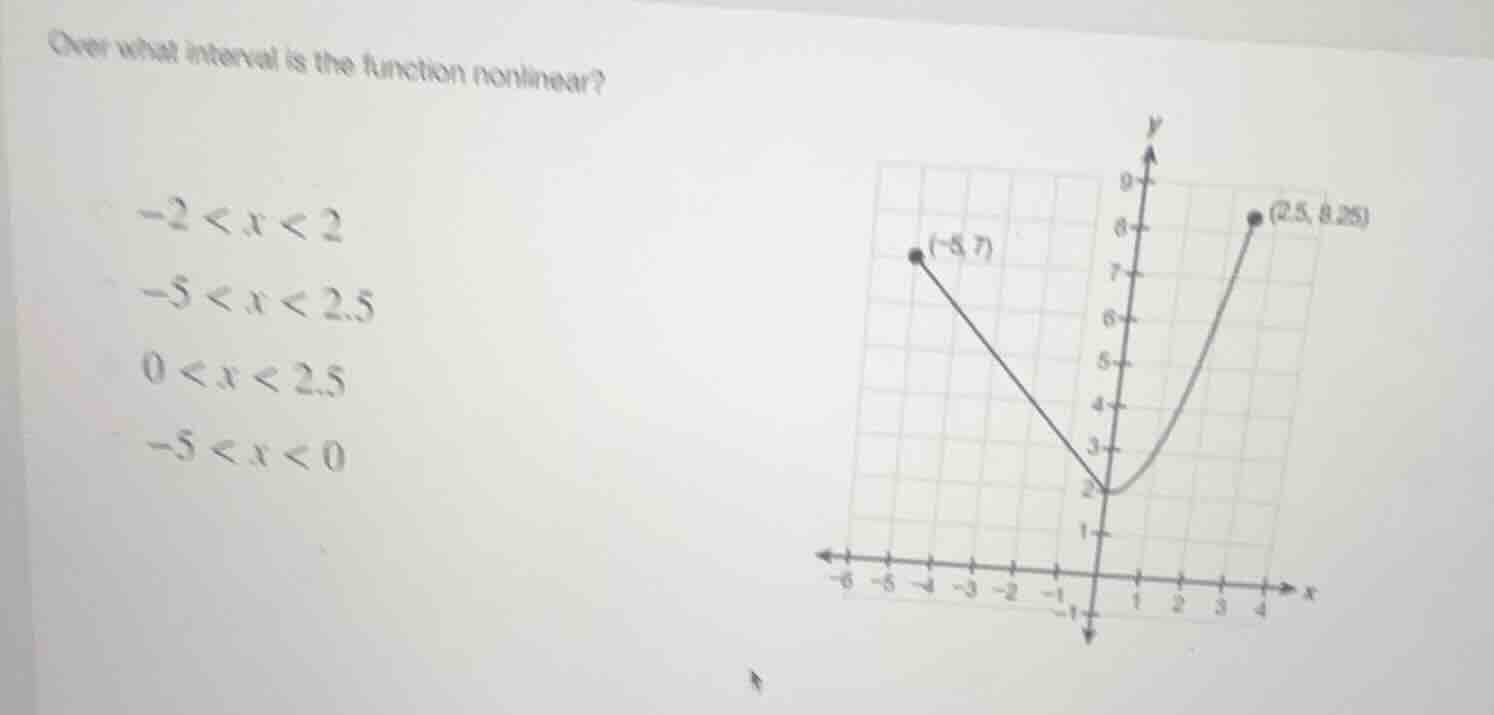
over what interval is the function nonlinear? -2 < x < 2 -5 < x < 2.5 0 < x < 2.5 -5 < x < 0
Step1: Define linear/nonlinear graphs
A linear function forms a straight line; a nonlinear function has a curved graph.
Step2: Analyze each interval
- For $-5 < x < 0$: The graph is a straight line (linear).
- For $0 < x < 2.5$: The graph is a curve (nonlinear).
- For $-2 < x < 2$: Part is straight, part is curved, not fully nonlinear.
- For $-5 < x < 2.5$: Includes linear and nonlinear sections, not fully nonlinear.

Snap & solve any problem in the app
Get step-by-step solutions on Sovi AI
Photo-based solutions with guided steps
Explore more problems and detailed explanations
$0 < x < 2.5$