QUESTION IMAGE
Question
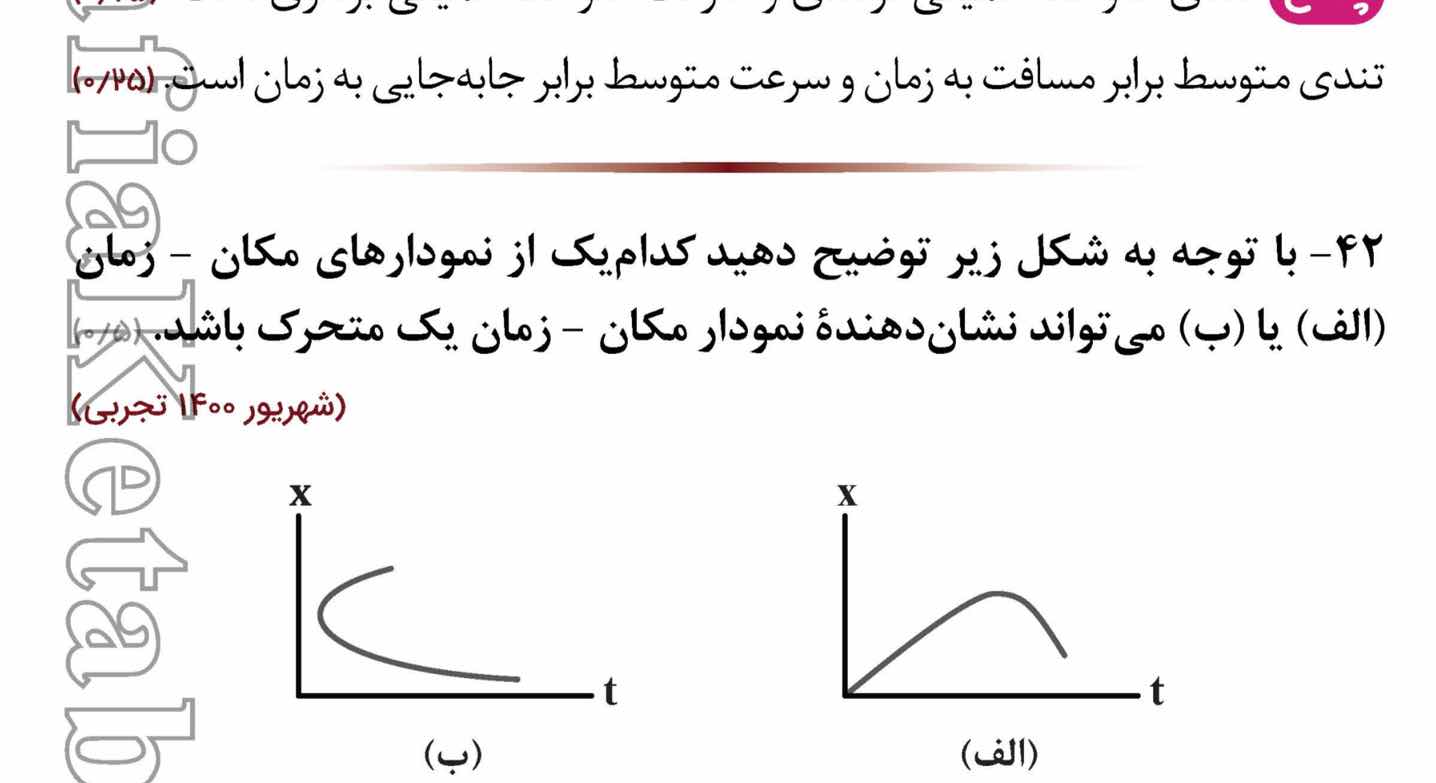
۴۲- با توجه به شکل زیر توضیح دهید کدام یک از نمودارهای مکان - زمان (الف) یا (ب) می تواند نشان دهنده نمودار مکان - زمان یک متحرک باشد.
Analyze graph (a)
$$
\forall t \ge 0, \quad |\{x : (t, x) \in \text{Graph (a)}\}| = 1
$$
Analyze graph (b)
$$
\exists t_1 > 0 \quad \text{such that} \quad |\{x : (t_1, x) \in \text{Graph (b)}\}| = 2
$$
Determine physical possibility
$$
\text{Graph (a) represents a physically possible motion because time cannot flow backwards to yield multiple positions at a single instant.}
$$

Snap & solve any problem in the app
Get step-by-step solutions on Sovi AI
Photo-based solutions with guided steps
Explore more problems and detailed explanations
Graph (a) can represent the position-time graph of a moving object.
In graph (b), drawing a vertical line intersects the curve at two points, which means the object would have to be at two different positions at the exact same instant in time. This is physically impossible. Graph (a) passes the vertical line test, meaning there is exactly one position for each instant in time.