QUESTION IMAGE
Question
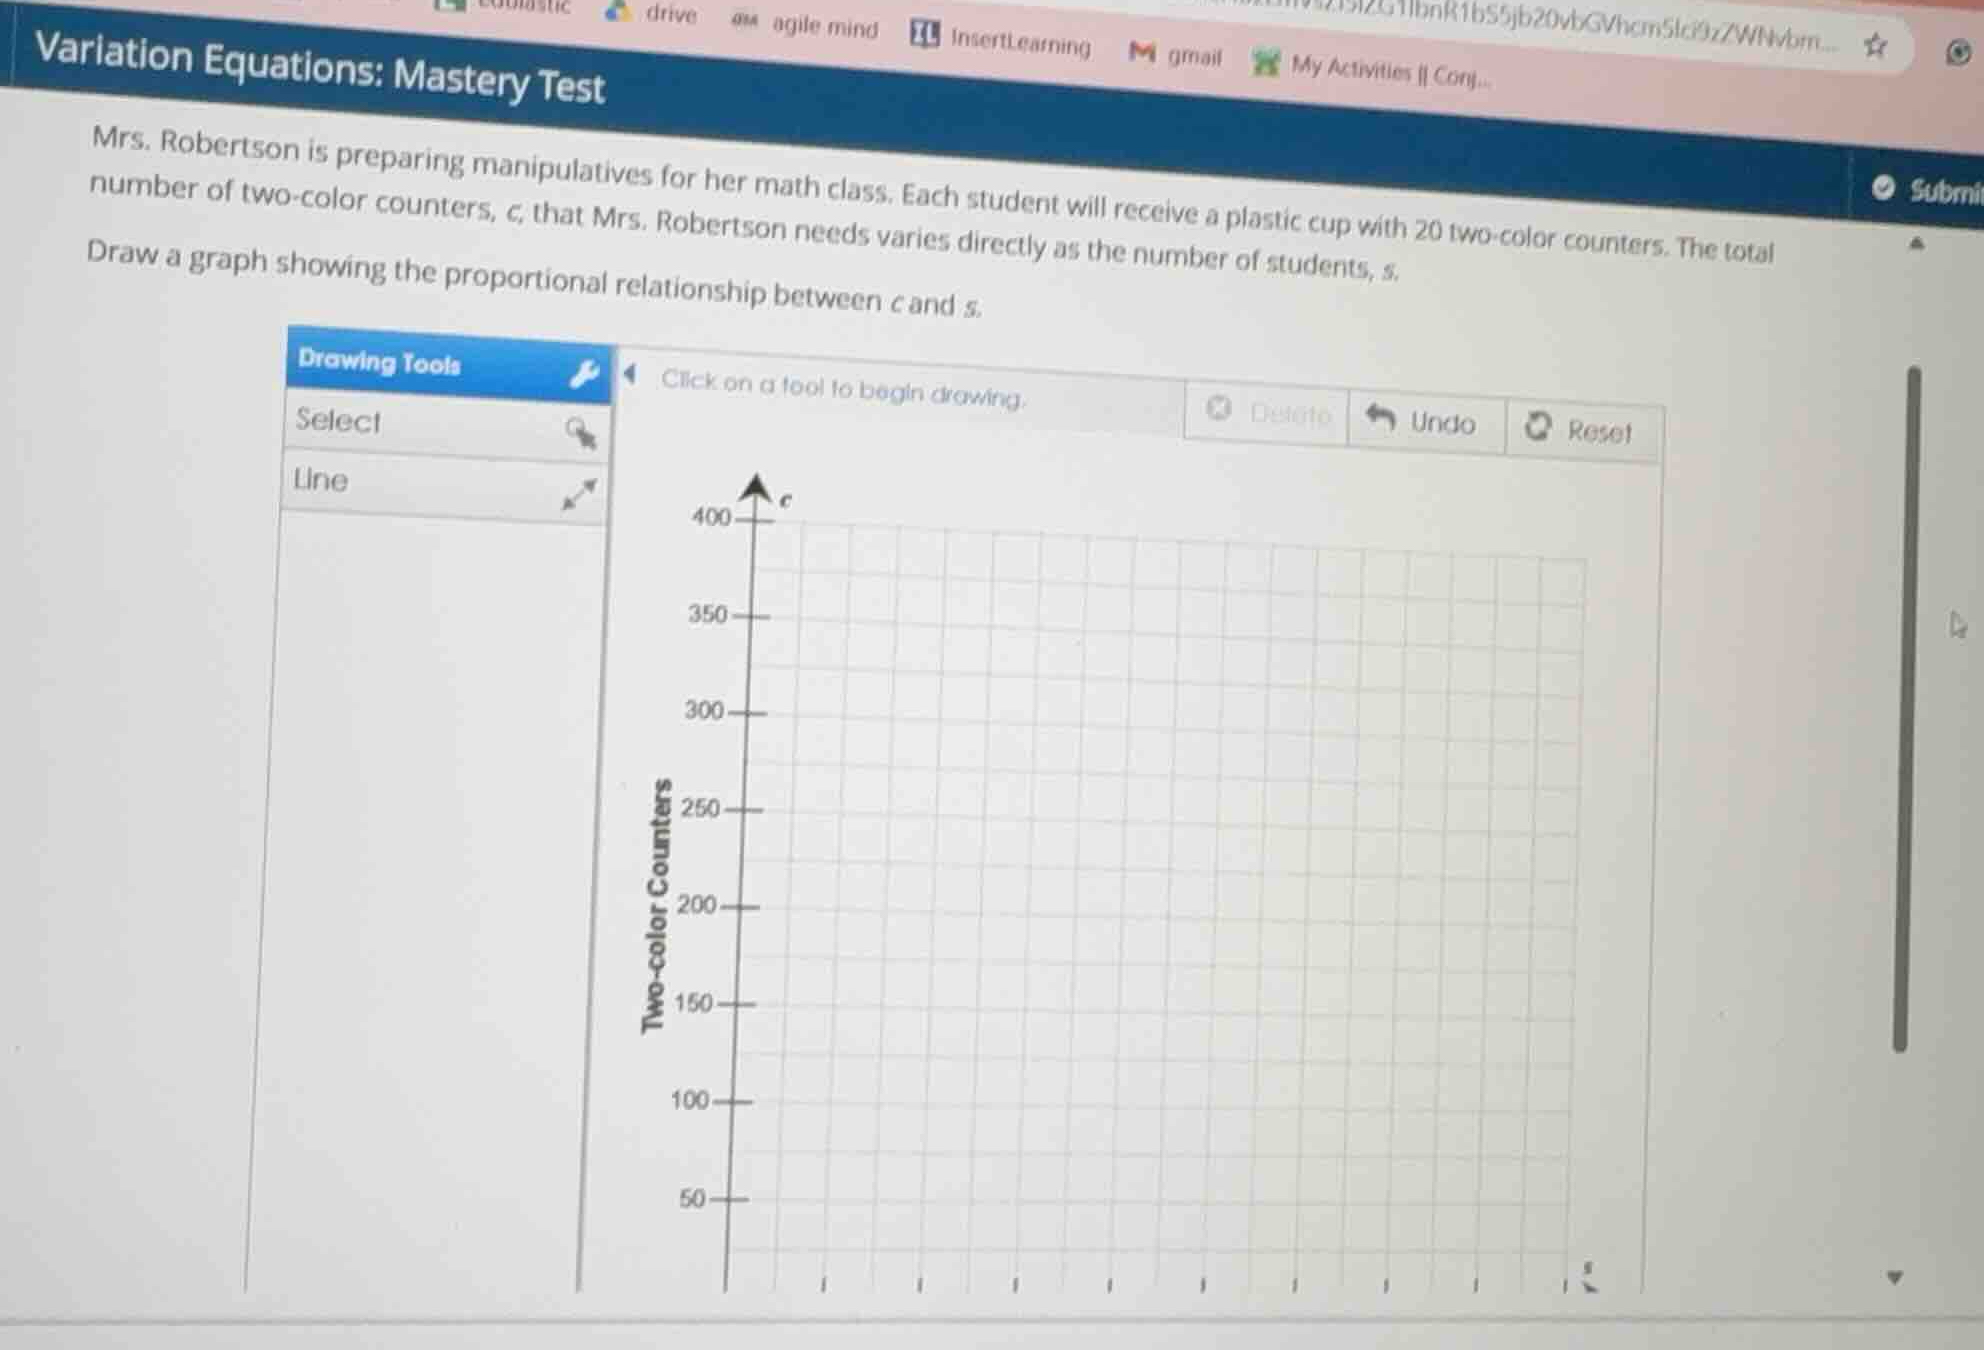
mrs. robertson is preparing manipulatives for her math class. each student will receive a plastic cup with 20 two-color counters. the total number of two-color counters, \\(c\\), that mrs. robertson needs varies directly as the number of students, \\(s\\).
draw a graph showing the proportional relationship between \\(c\\) and \\(s\\).
Determine the direct variation equation
$$
LATEXBLOCK0
$$
Identify key points for graphing
$$
LATEXBLOCK1
$$

Snap & solve any problem in the app
Get step-by-step solutions on Sovi AI
Photo-based solutions with guided steps
Explore more problems and detailed explanations
The proportional relationship is represented by the direct variation equation:
$$c = 20s$$
To draw the graph, plot a line starting at the origin \((0, 0)\) and passing through the point \((10, 200)\) or \((20, 400)\).