QUESTION IMAGE
Question
4.6 module 4 post-test
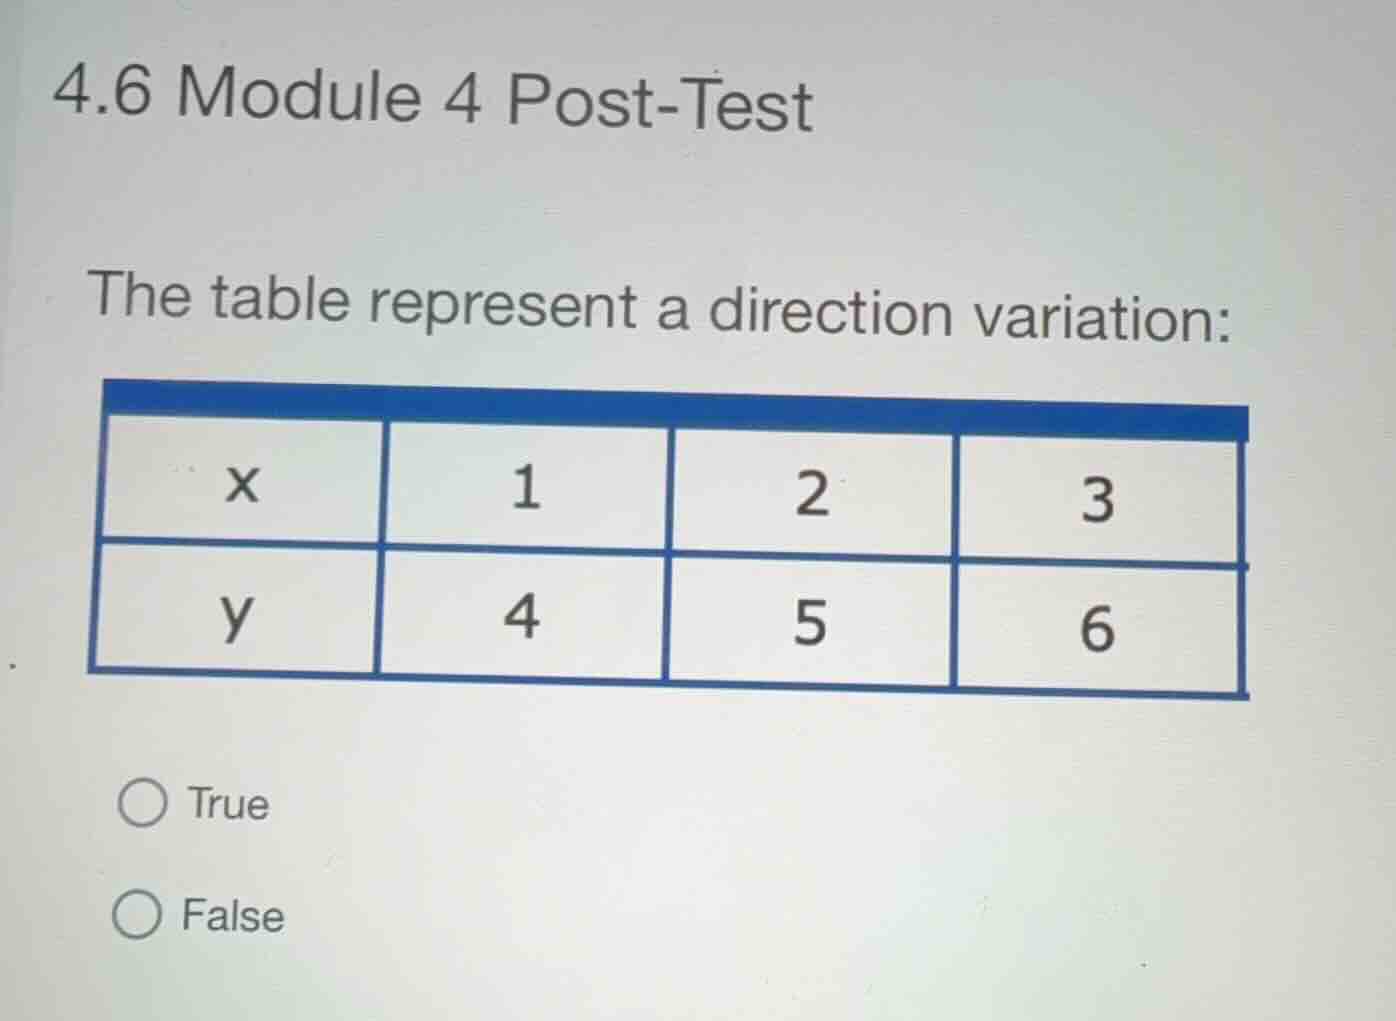
the table represent a direction variation:
\
true
false
Define direct variation
Using the Direct Variation knowledge point, a relationship between two variables, \(x\) and \(y\), is a direct variation if it can be expressed in the form:
where \(k\) is a non-zero constant called the constant of variation. This means the ratio of \(y\) to \(x\) must be constant for all data points:
Calculate the ratios
We test the given data points from the table to see if they share a constant ratio \(\frac{y}{x}\).
For the first data point \((1, 4)\):
For the second data point \((2, 5)\):
For the third data point \((3, 6)\):
Compare the ratios
We compare the calculated ratios to check for consistency:
Since the ratio \(\frac{y}{x}\) is not constant, the relationship shown in the table does not represent a direct variation. Therefore, the statement is false.

Snap & solve any problem in the app
Get step-by-step solutions on Sovi AI
Photo-based solutions with guided steps
Explore more problems and detailed explanations
- True
- False (Correct answer)