QUESTION IMAGE
Question
mastering biology assignment 6
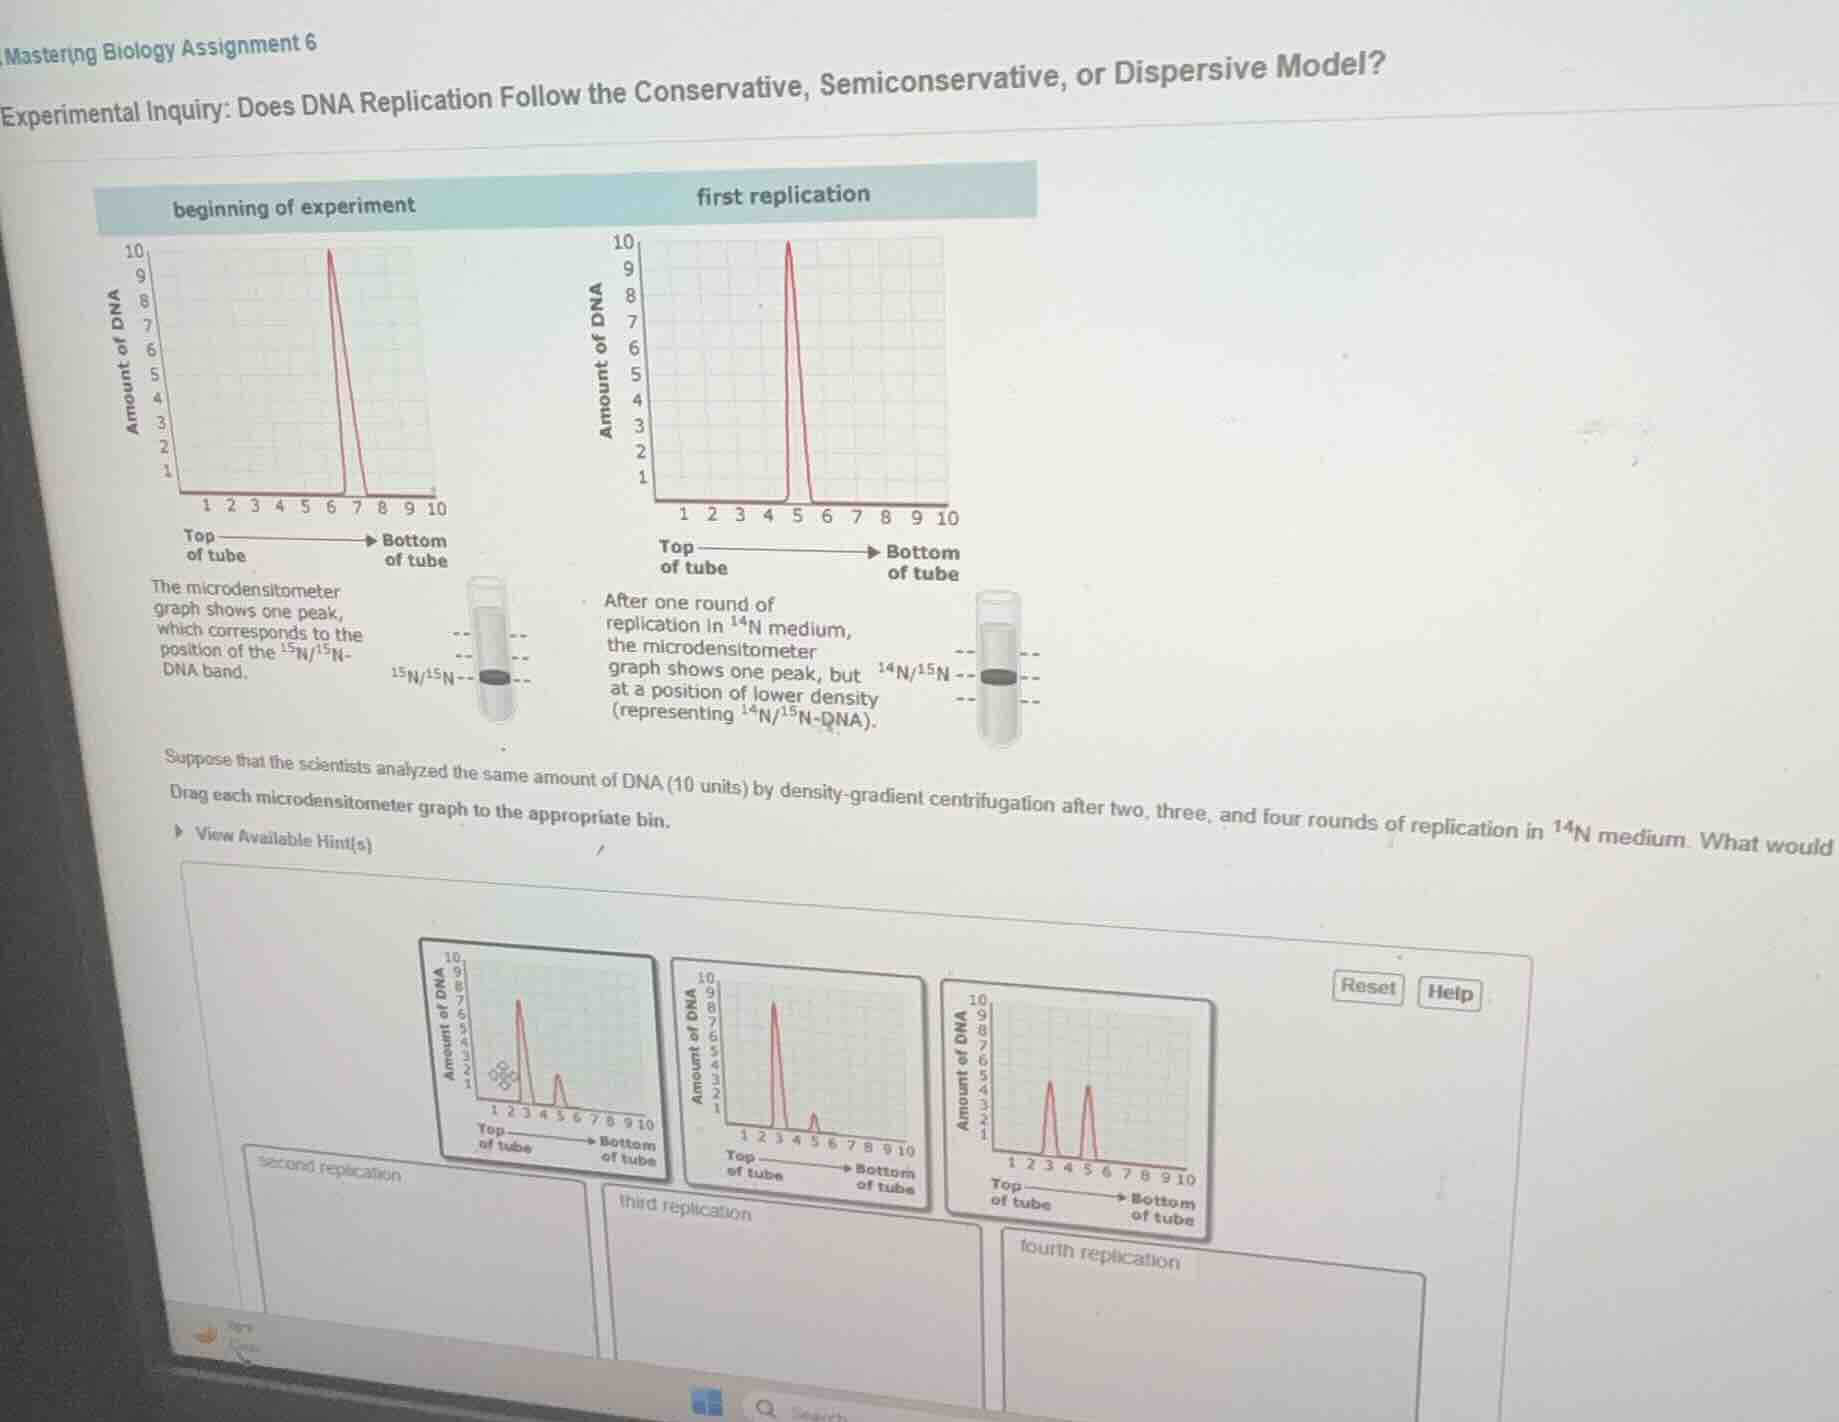
experimental inquiry: does dna replication follow the conservative, semiconservative, or dispersive model?
suppose that the scientists analyzed the same amount of dna (10 units) by density-gradient centrifugation after two, three, and four rounds of replication in \\(^{14}\text{n}\\) medium. what would
drag each microdensitometer graph to the appropriate bin.
Analyze DNA ratios per replication round
The experiment starts with 10 units of heavy $^{15}\text{N}/^{15}\text{N}$ DNA (peak at position 7).
After one round of replication in $^{14}\text{N}$ medium, all DNA is hybrid $^{14}\text{N}/^{15}\text{N}$ (10 units, peak at position 5).
For subsequent rounds in $^{14}\text{N}$ medium:
- Second replication: Out of 4 double helices (representing 10 units of DNA), 2 are hybrid $^{14}\text{N}/^{15}\text{N}$ and 2 are light $^{14}\text{N}/^{14}\text{N}$.
- Hybrid DNA ($^{14}\text{N}/^{15}\text{N}$): $50\%$ of total DNA = 5 units (peak at position 5).
- Light DNA ($^{14}\text{N}/^{14}\text{N}$): $50\%$ of total DNA = 5 units (peak at position 3).
- This matches the third graph (two equal peaks of height 5 at positions 3 and 5).
- Third replication: Out of 8 double helices (representing 10 units of DNA), 2 are hybrid $^{14}\text{N}/^{15}\text{N}$ and 6 are light $^{14}\text{N}/^{14}\text{N}$.
- Hybrid DNA ($^{14}\text{N}/^{15}\text{N}$): $25\%$ of total DNA = 2.5 units (peak at position 5).
- Light DNA ($^{14}\text{N}/^{14}\text{N}$): $75\%$ of total DNA = 7.5 units (peak at position 3).
- This matches the first graph (a tall peak of height 7.5 at position 3, and a shorter peak of height 2.5 at position 5).
- Fourth replication: Out of 16 double helices (representing 10 units of DNA), 2 are hybrid $^{14}\text{N}/^{15}\text{N}$ and 14 are light $^{14}\text{N}/^{14}\text{N}$.
- Hybrid DNA ($^{14}\text{N}/^{15}\text{N}$): $12.5\%$ of total DNA = 1.25 units (peak at position 5).
- Light DNA ($^{14}\text{N}/^{14}\text{N}$): $87.5\%$ of total DNA = 8.75 units (peak at position 3).
- This matches the second graph (a very tall peak of height 8.75 at position 3, and a very small peak of height 1.25 at position 5).
Match graphs to bins
- Second replication bin: Graph with two equal peaks of height 5 at positions 3 and 5 (the third graph shown in the selection).
- Third replication bin: Graph with a peak of height 7.5 at position 3 and a peak of height 2.5 at position 5 (the first graph shown in the selection).
- Fourth replication bin: Graph with a peak of height 8.75 at position 3 and a peak of height 1.25 at position 5 (the second graph shown in the selection).

Snap & solve any problem in the app
Get step-by-step solutions on Sovi AI
Photo-based solutions with guided steps
Explore more problems and detailed explanations
The correct placement of the microdensitometer graphs into each replication bin is as follows:
- Second replication: The graph showing two equal peaks of height 5 at position 3 ($^{14}\text{N}/^{14}\text{N}$) and position 5 ($^{14}\text{N}/^{15}\text{N}$). (This is the third graph in the selection)
- Third replication: The graph showing a tall peak of height 7.5 at position 3 ($^{14}\text{N}/^{14}\text{N}$) and a shorter peak of height 2.5 at position 5 ($^{14}\text{N}/^{15}\text{N}$). (This is the first graph in the selection)
- Fourth replication: The graph showing a very tall peak of height 8.75 at position 3 ($^{14}\text{N}/^{14}\text{N}$) and a very small peak of height 1.25 at position 5 ($^{14}\text{N}/^{15}\text{N}$). (This is the second graph in the selection)