QUESTION IMAGE
Question
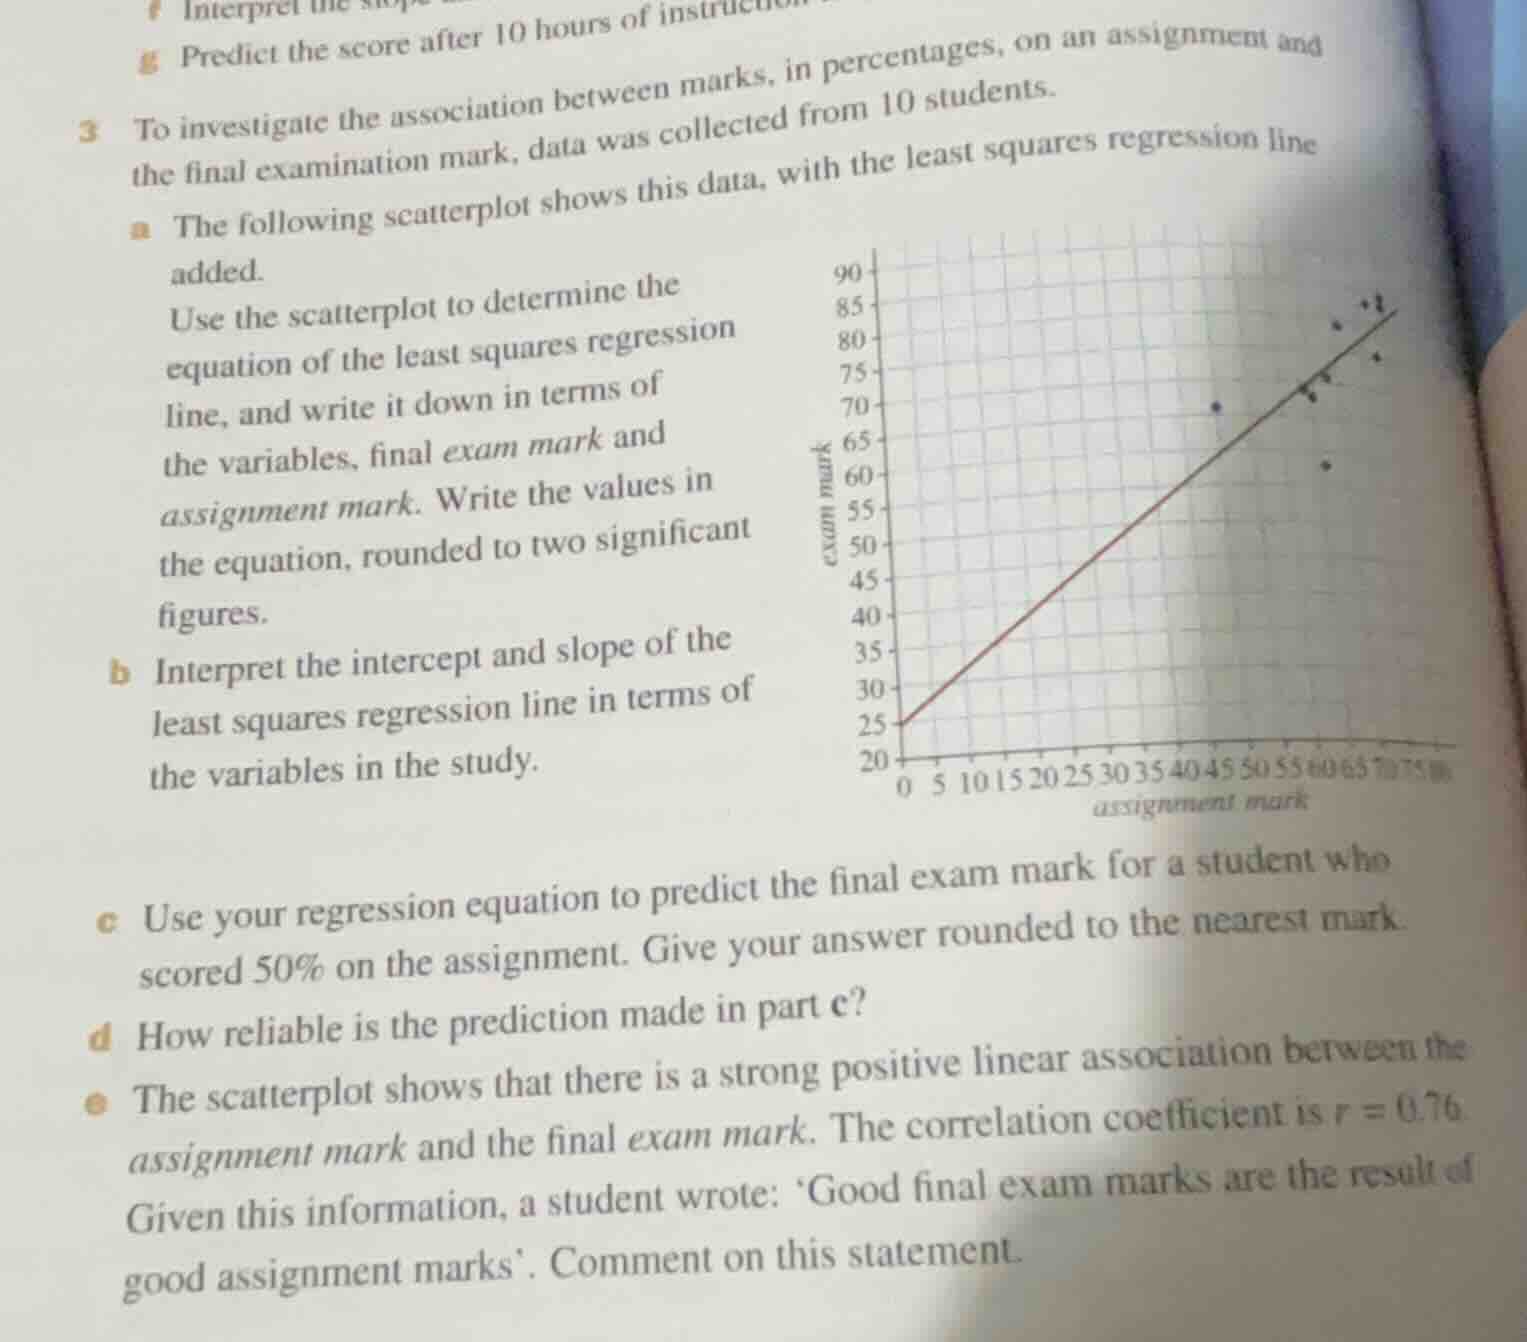
3 to investigate the association between marks, in percentages, on an assignment and the final examination mark, data was collected from 10 students.
a the following scatterplot shows this data, with the least squares regression line added.
use the scatterplot to determine the equation of the least squares regression line, and write it down in terms of the variables, final exam mark and assignment mark. write the values in the equation, rounded to two significant figures.
b interpret the intercept and slope of the least squares regression line in terms of the variables in the study.
c use your regression equation to predict the final exam mark for a student who scored 50% on the assignment. give your answer rounded to the nearest mark.
d how reliable is the prediction made in part c?
e the scatterplot shows that there is a strong positive linear association between the assignment mark and the final exam mark. the correlation coefficient is r = 0.76. given this information, a student wrote: good final exam marks are the result of good assignment marks. comment on this statement.
⚡ Using what you learned: regression
Step 1: Find the equation of the regression line (Part a)
To find the equation of the least squares regression line in the form \( y = mx + c \), we identify two clear points on the line from the scatterplot:
- The \(y\)-intercept (\(x = 0\)) is at \(y = 25\). Thus, \(c = 25\).
- Another clear point on the line is at \(x = 65\), \(y = 80\).
Calculate the slope (\(m\)):
\[ m = \frac{y_2 - y_1}{x_2 - x_1} = \frac{80 - 25}{65 - 0} = \frac{55}{65} \approx 0.846 \]
Rounding both values to two significant figures:
- Intercept: \(25\)
- Slope: \(0.85\)
Expressing the equation in terms of the variables:
\[ \text{exam mark} = 25 + 0.85 \times \text{assignment mark} \]
Step 2: Interpret the intercept and slope (Part b)
- Intercept (25): On average, a student who scores \(0\%\) on the assignment is predicted to score \(25\%\) on the final exam.
- Slope (0.85): For every \(1\%\) increase in the assignment mark, the predicted final exam mark increases by \(0.85\%\).
Step 3: Predict the exam mark for a 50% assignment score (Part c)
Substitute \(\text{assignment mark} = 50\) into the regression equation:
\[ \text{exam mark} = 25 + 0.85 \times 50 = 25 + 42.5 = 67.5\% \]
Rounding to the nearest whole mark:
\[ \text{exam mark} \approx 68\% \]
Step 4: Assess the reliability of the prediction (Part d)
The prediction is highly reliable because:
- An assignment mark of \(50\%\) lies within the range of the observed data (interpolation).
- The correlation coefficient (\(r = 0.76\)) indicates a strong positive linear relationship.
Step 5: Comment on the student's statement (Part e)
The student's statement implies causation ("are the result of"). Correlation does not equal causation. While there is a strong positive association between assignment marks and exam marks, we cannot conclude that good assignment marks cause good exam marks. Both could be influenced by a confounding variable, such as student effort or understanding of the course material.

Snap & solve any problem in the app
Get step-by-step solutions on Sovi AI
Photo-based solutions with guided steps
Explore more problems and detailed explanations
- a. \(\text{exam mark} = 25 + 0.85 \times \text{assignment mark}\)
- b. Intercept: A student scoring \(0\%\) on the assignment is predicted to score \(25\%\) on the exam. Slope: Each \(1\%\) increase in assignment mark is associated with a \(0.85\%\) increase in exam mark.
- c. \(68\%\)
- d. Reliable, as it is interpolation within the range of the data and the correlation is strong.
- e. Incorrect; correlation does not imply causation. A strong association does not mean the assignment mark directly causes the exam mark.