QUESTION IMAGE
Question
Question was provided via image upload.
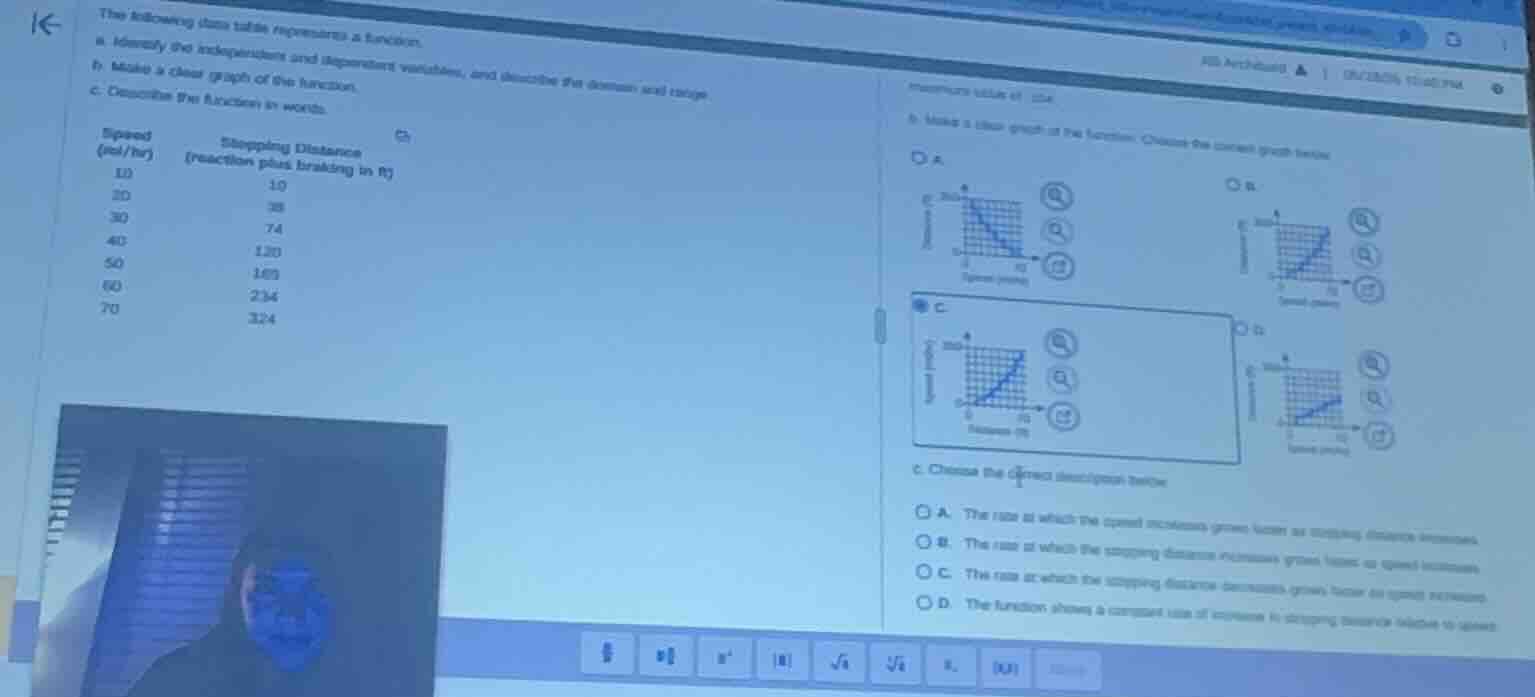
Identify variables, domain, and range
Using the Independent and Dependent Variables and Domain and Range knowledge points
- Independent variable: Speed \(s\) in miles per hour (mi/hr).
- Dependent variable: Stopping distance \(d\) in feet (ft).
- Domain: \(\{10, 20, 30, 40, 50, 60, 70\}\)
- Range: \(\{10, 38, 74, 120, 169, 234, 324\}\)
Select the correct graph
Using the Graphing Functions from Data and Stopping Distance Modeling knowledge points
- The independent variable (Speed) must be on the horizontal axis (\(x\)-axis), ranging from \(0\) to \(80\).
- The dependent variable (Stopping Distance) must be on the vertical axis (\(y\)-axis), ranging from \(0\) to \(350\).
- The data points show a curve that bends upward because the stopping distance increases at an accelerating rate as speed increases.
- Graph B shows Distance on the vertical axis and Speed on the horizontal axis, with a curve bending upward matching the data points: \((10, 10), (20, 38), (30, 74), (40, 120), (50, 169), (60, 234), (70, 324)\).
Describe the function in words
Using the Stopping Distance Modeling knowledge point
- Let's analyze the rate of change:
- From \(10\) to \(20\) mi/hr: increase is \(38 - 10 = 28\) ft.
- From \(20\) to \(30\) mi/hr: increase is \(74 - 38 = 36\) ft.
- From \(30\) to \(40\) mi/hr: increase is \(120 - 74 = 46\) ft.
- From \(40\) to \(50\) mi/hr: increase is \(169 - 120 = 49\) ft.
- From \(50\) to \(60\) mi/hr: increase is \(234 - 169 = 65\) ft.
- From \(60\) to \(70\) mi/hr: increase is \(324 - 234 = 90\) ft.
- The rate at which the stopping distance increases grows faster as speed increases. This matches option B.

Snap & solve any problem in the app
Get step-by-step solutions on Sovi AI
Photo-based solutions with guided steps
Explore more problems and detailed explanations
Question a
- Independent variable: Speed (mi/hr)
- Dependent variable: Stopping Distance (ft)
- Domain: \(\{10, 20, 30, 40, 50, 60, 70\}\)
- Range: \(\{10, 38, 74, 120, 169, 234, 324\}\)
Question b
- (A) Graph with Distance on horizontal axis and Speed on vertical axis
- (B) Graph with Speed on horizontal axis and Distance on vertical axis, showing an upward-curving trend (Correct answer)
- (C) Graph with Speed on vertical axis and Distance on horizontal axis
- (D) Graph showing a downward trend
Question c
- (A) The rate at which the speed increases grows faster as stopping distance increases.
- (B) The rate at which the stopping distance increases grows faster as speed increases. (Correct answer)
- (C) The rate at which the stopping distance decreases grows faster as speed increases.
- (D) The function shows a constant rate of increase in stopping distance relative to speed.