QUESTION IMAGE
Question
Question was provided via image upload.
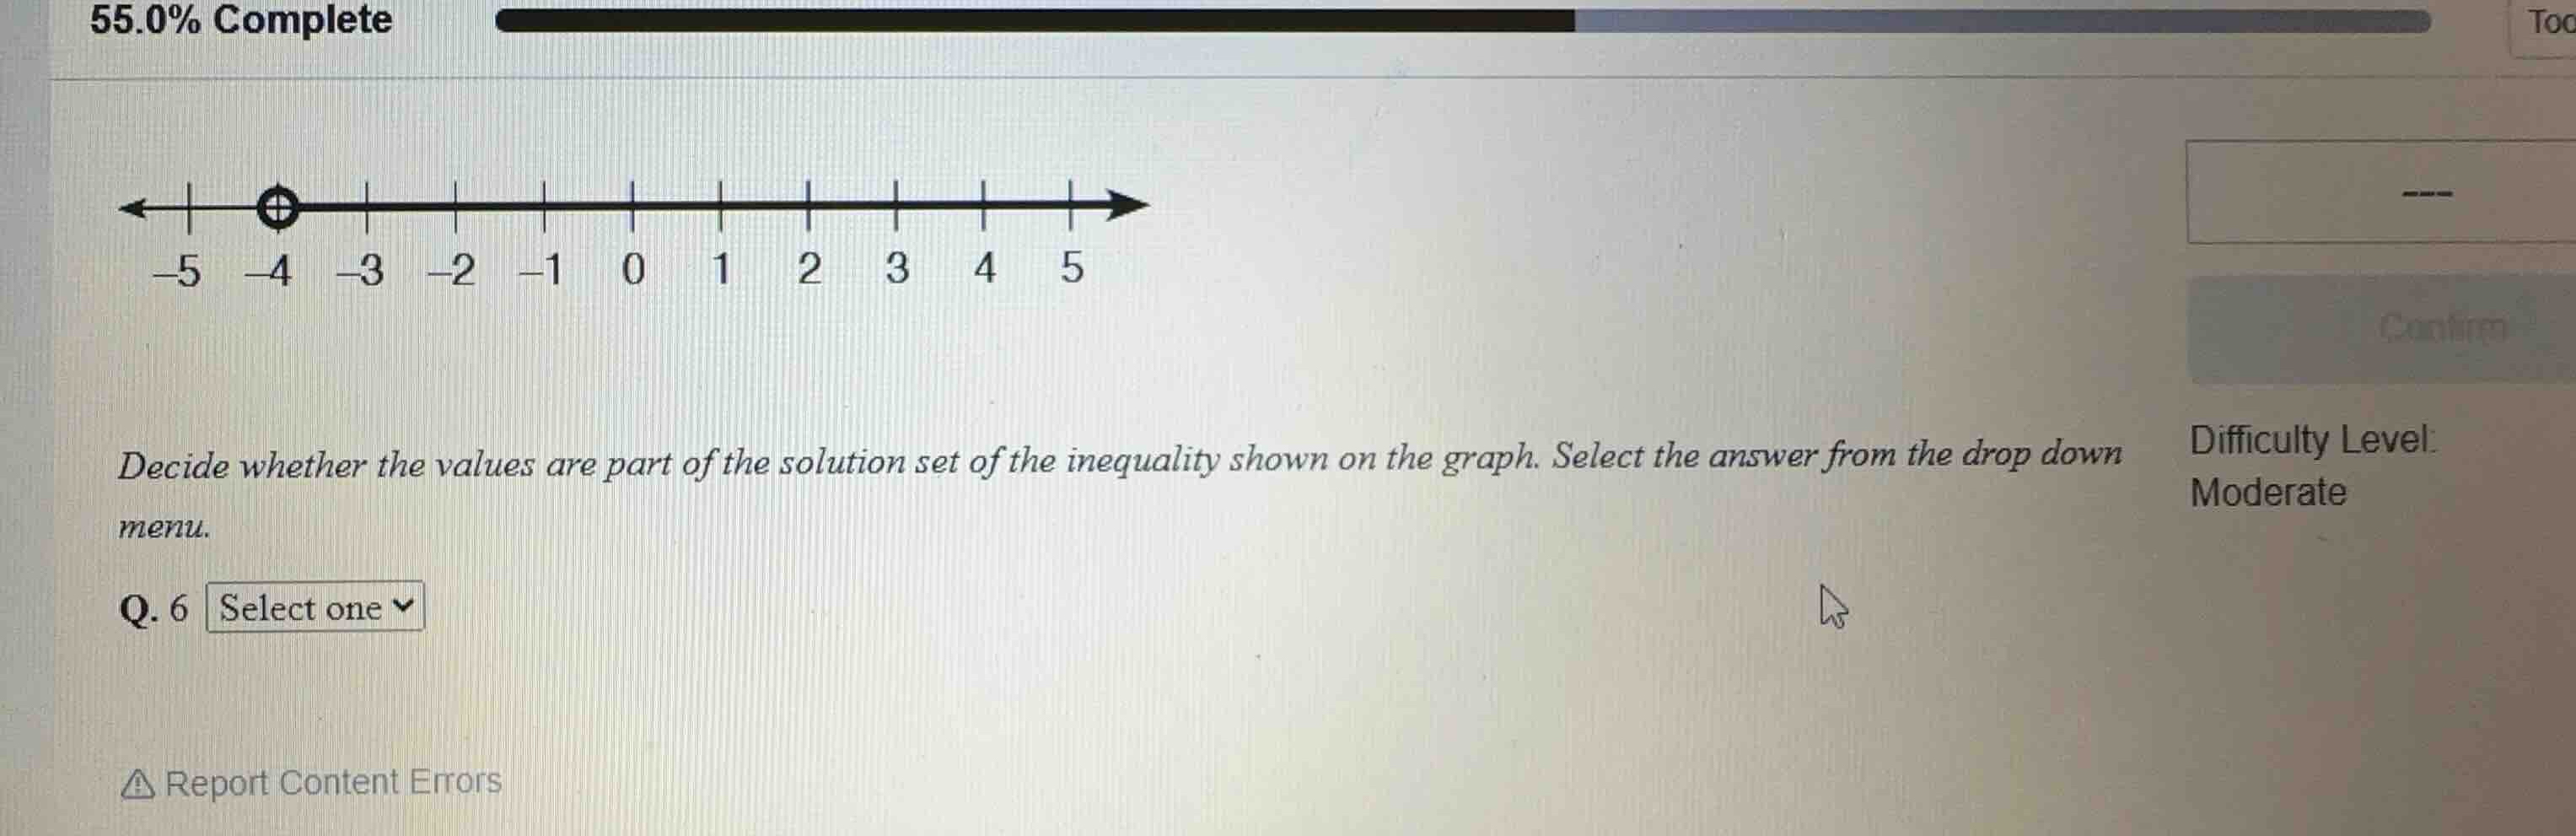
Identify the inequality from the graph
Using the Graphing Linear Inequalities knowledge point
- The graph shows an open circle at \(x = -4\).
- The shaded region extends to the right of \(-4\).
- This represents the inequality \(x > -4\).
Determine the solution set criteria
Using the Inequality Solution Sets knowledge point
- A value \(v\) is in the solution set if and only if \(v > -4\).
- Values strictly greater than \(-4\) are solutions.
- The value \(-4\) itself is not a solution because of the open circle.
- Values less than \(-4\) are not solutions.

Snap & solve any problem in the app
Get step-by-step solutions on Sovi AI
Photo-based solutions with guided steps
Explore more problems and detailed explanations
Decide whether the values are part of the solution set of the inequality shown on the graph. Select the answer from the drop down menu.
The inequality shown on the graph is <blank>\(x > -4\)</blank>.