QUESTION IMAGE
Question
Question was provided via image upload.
Analyze the given conditions
We are given three conditions describing the behavior of a stock price over time:
- The price of the stock rose to about \$17 before falling to about \$3.
- There have only been two periods during which the price of the stock decreased.
- The price of the stock is expected to increase in the long run.
Evaluate the visible graph
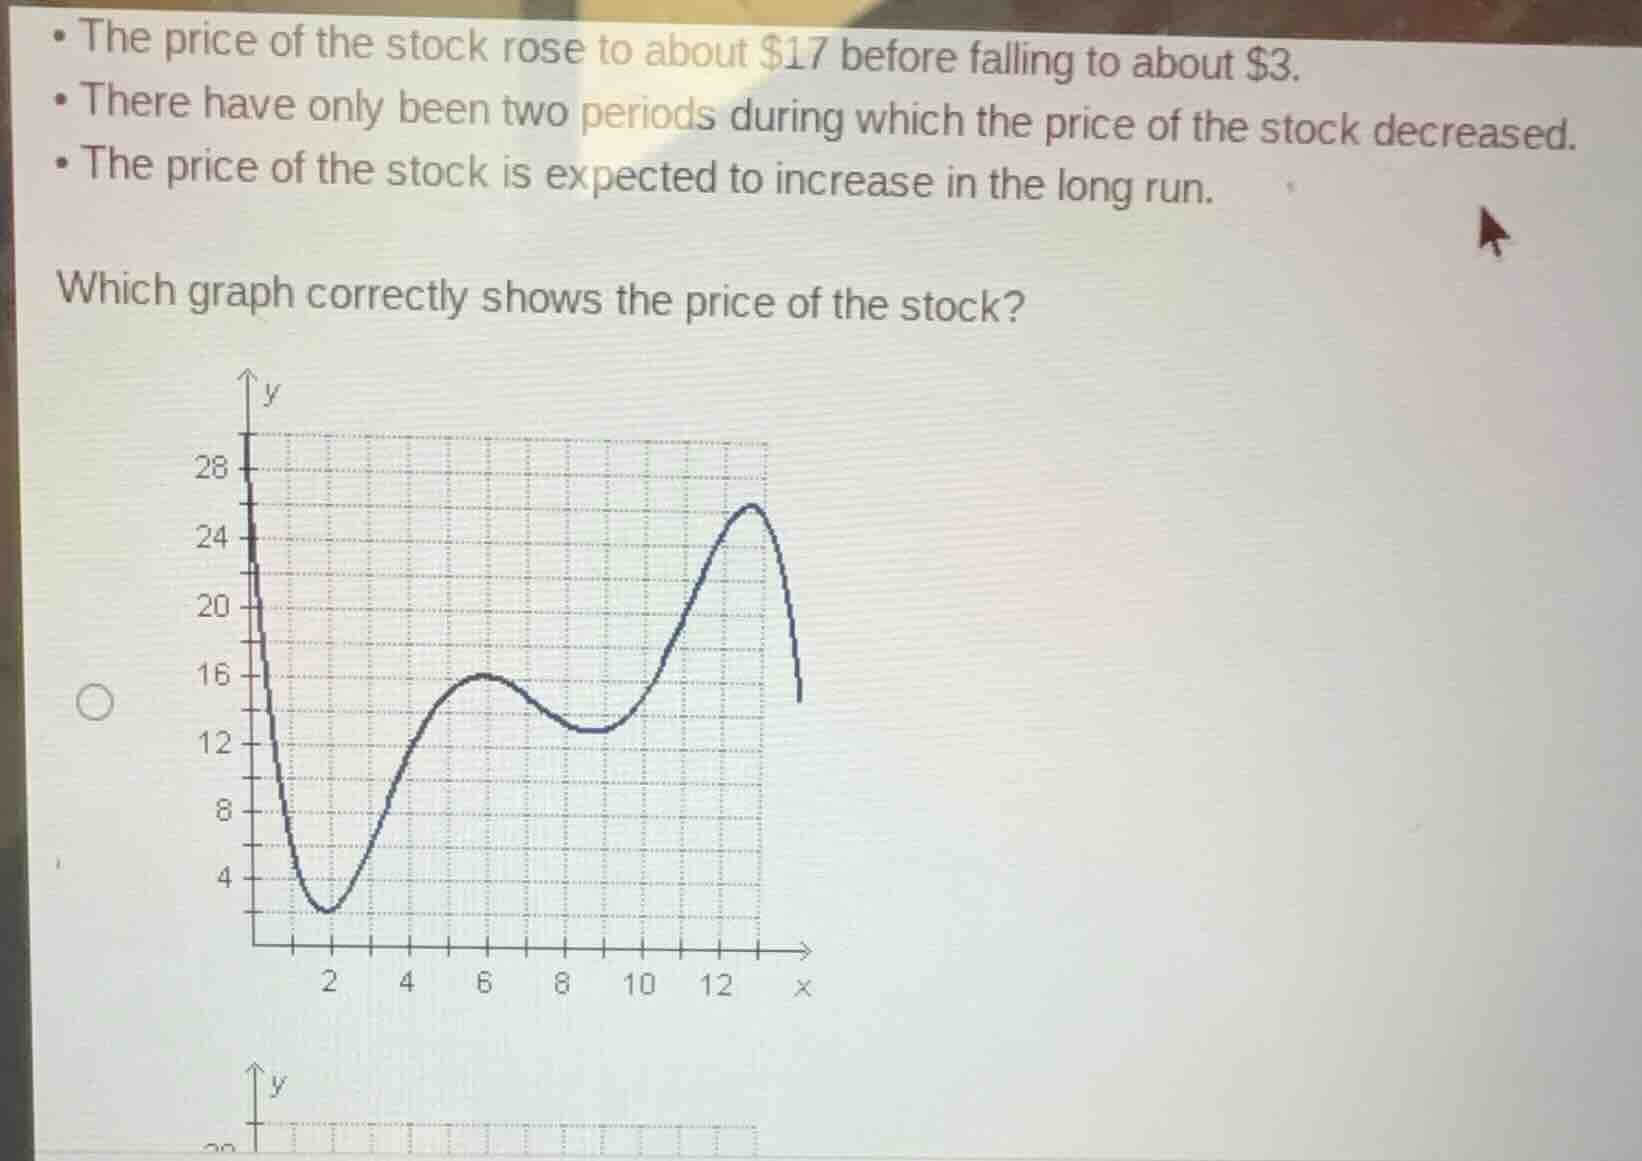
Let's analyze the behavior of the function shown in the first graph:
- Initial behavior: The graph starts at a high value on the y-axis (around 24) and decreases to a local minimum at \(x = 2\) with a value of \(y = 2\). This represents the first decreasing period.
- First rise: From \(x = 2\), the graph rises to a local maximum at \(x = 6\) with a value of \(y = 16\). This does not match the first condition, which states it rose to about \$17 before falling to about \$3. Here, it rose to \$16 and then fell to about \$13 at \(x = 9\).
- Second rise: From \(x = 9\), it rises to a peak of about \$26 at \(x = 13\), and then decreases again.
- Long-run behavior: At the far right, the graph is heading downwards, which contradicts the third condition that the stock is expected to increase in the long run.
Determine the correct graph characteristics
A graph that correctly represents all three conditions must have the following features:
- An initial rise that reaches a peak of approximately \$17, followed by a decrease to a low point of approximately \$3.
- Exactly two intervals where the curve goes downwards (two decreasing periods).
- An overall upward trend at the right end of the graph (pointing upwards as \(x\) increases) to show long-run growth.
Since the visible graph fails these criteria (it decreases to \$2 first, rises to \$16, decreases to \$13, rises to \$26, and then falls), the correct choice must be one of the other options not fully visible in this cropped image.

Snap & solve any problem in the app
Get step-by-step solutions on Sovi AI
Photo-based solutions with guided steps
Explore more problems and detailed explanations
Based on the given conditions, the correct graph must satisfy the following:
- It must first rise to a peak of approximately \$17 and then fall to a low point of approximately \$3.
- It must have exactly two downward-sloping (decreasing) sections.
- The rightmost end of the graph must point upwards, indicating a long-run increase.
The visible graph does not meet these criteria because it starts by decreasing to \$2, peaks at \$16, and ends with a downward trend. Therefore, the correct graph is one of the other choices that shows an initial rise to \$17, a drop to \$3, exactly two decreasing periods, and ends pointing upwards.