QUESTION IMAGE
Question
Question was provided via image upload.
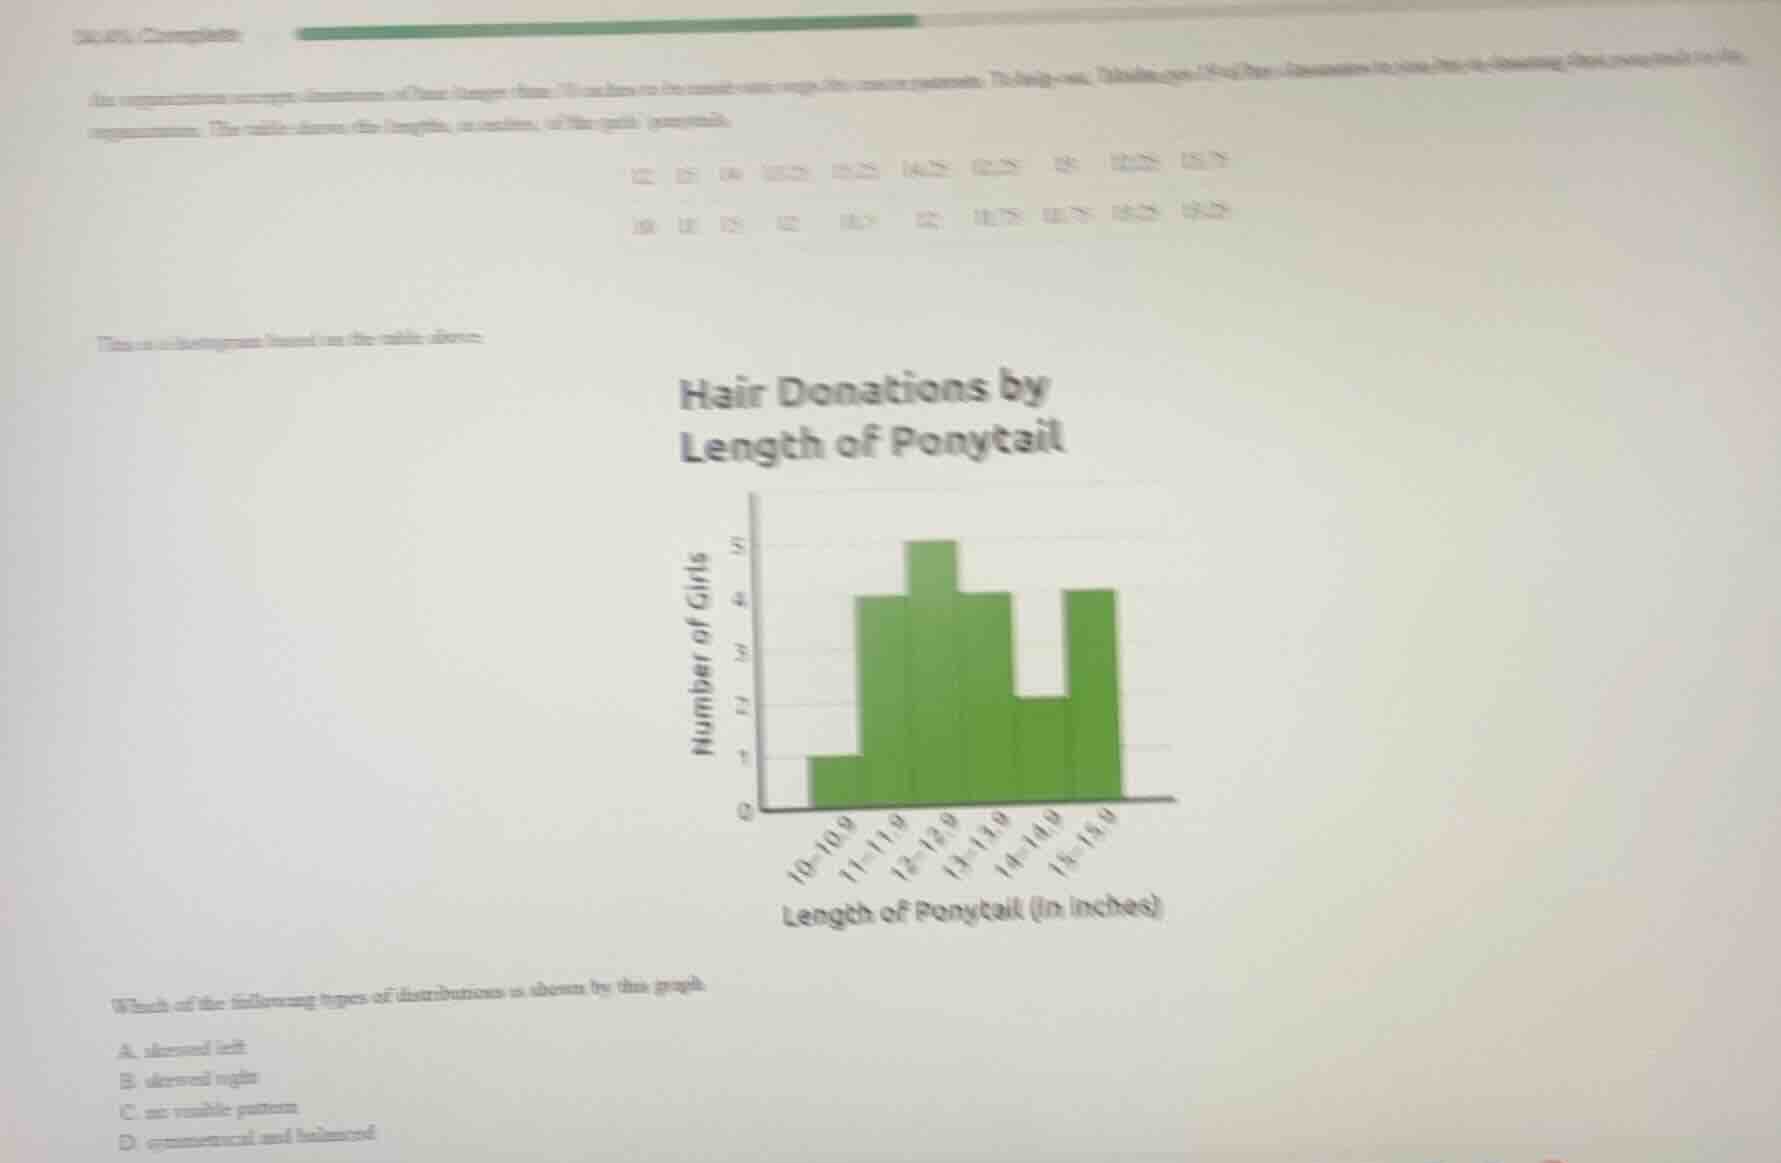
Analyze the shape of the histogram
The histogram displays the distribution of ponytail lengths. We observe the heights of the bars for each interval from left to right:
- \(10\text{--}10.9\): 1
- \(11\text{--}11.9\): 4
- \(12\text{--}12.9\): 5
- \(13\text{--}13.9\): 4
- \(14\text{--}14.9\): 2
- \(15\text{--}15.9\): 4
Evaluate skewness and symmetry
- A distribution is skewed left if it has a long tail on the left side.
- A distribution is skewed right if it has a long tail on the right side.
- A distribution is symmetrical if the left and right sides are approximately mirror images.
- Looking at the data, there is a tail extending to the left (the single low value in the \(10\text{--}10.9\) range), and the peak is around \(12\text{--}12.9\). However, the right side also rises back up to 4 at the \(15\text{--}15.9\) interval, making it asymmetric and irregular.
- Let's re-examine standard definitions for school curricula: a distribution with a longer tail on the left is classified as "skewed left". Here, the lower values stretch out further to the left (down to 10) with a very low frequency (1), whereas the right side ends abruptly at 15.9 with a high frequency (4). This creates a longer tail on the left side, indicating a left-skewed distribution.
Match with the options
- A. skewed left
- B. skewed right
- C. no visible pattern
- D. symmetrical and balanced
The presence of the left tail makes "skewed left" the most appropriate classification.

Snap & solve any problem in the app
Get step-by-step solutions on Sovi AI
Photo-based solutions with guided steps
Explore more problems and detailed explanations
- (A) skewed left (Correct answer)
- (B) skewed right
- (C) no visible pattern
- (D) symmetrical and balanced