QUESTION IMAGE
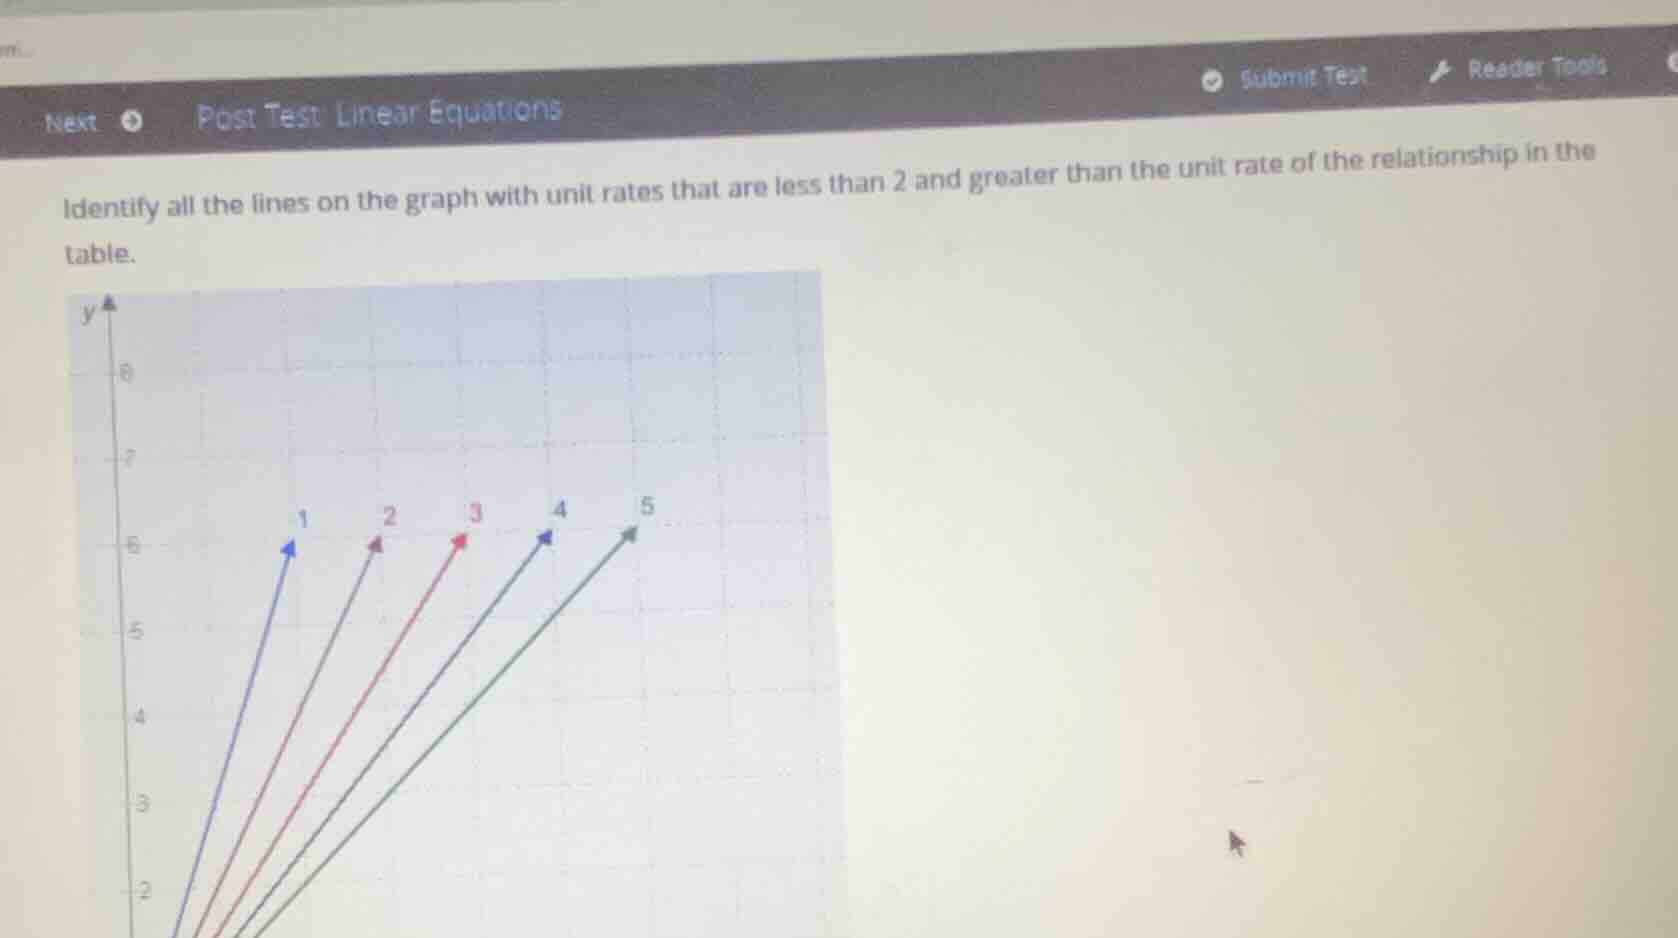
Question
Question was provided via image upload.
Calculate unit rate from the table
$$
\text{Since the table is missing from the image, let us analyze the slopes of the lines on the graph: }
$$
$$
LATEXBLOCK0
$$
Determine the target unit rate range
$$
\text{We need lines with unit rates } m \text{ such that: }
$$
$$
\text{Unit rate of table} < m < 2
$$
$$
\text{Since } m < 2\text{, we must choose from Lines 3, 4, and 5 (slopes } 1.5, 1.2, 1\text{).}
$$
$$
\text{Assuming a standard curriculum problem where the table represents a unit rate of } 1 \text{ (or } 1.2\text{):}
$$
$$
\text{If table rate } = 1 \implies 1 < m < 2 \implies \text{Lines 3 and 4}
$$
$$
\text{If table rate } = 1.2 \implies 1.2 < m < 2 \implies \text{Line 3}
$$

Snap & solve any problem in the app
Get step-by-step solutions on Sovi AI
Photo-based solutions with guided steps
Explore more problems and detailed explanations
Based on the slopes of the lines in the graph:
- Line 1: unit rate = \(3\)
- Line 2: unit rate = \(2\)
- Line 3: unit rate = \(1.5\)
- Line 4: unit rate = \(1.2\)
- Line 5: unit rate = \(1\)
To have a unit rate less than \(2\), the lines must be chosen from Line 3, Line 4, or Line 5.
(Note: Since the referenced table is not visible in the image, compare these values to the unit rate from your table to find the final subset. For example, if the table's unit rate is \(1\), the correct lines are Line 3 and Line 4).