QUESTION IMAGE
Question
Question was provided via image upload.
Identify the missing table data
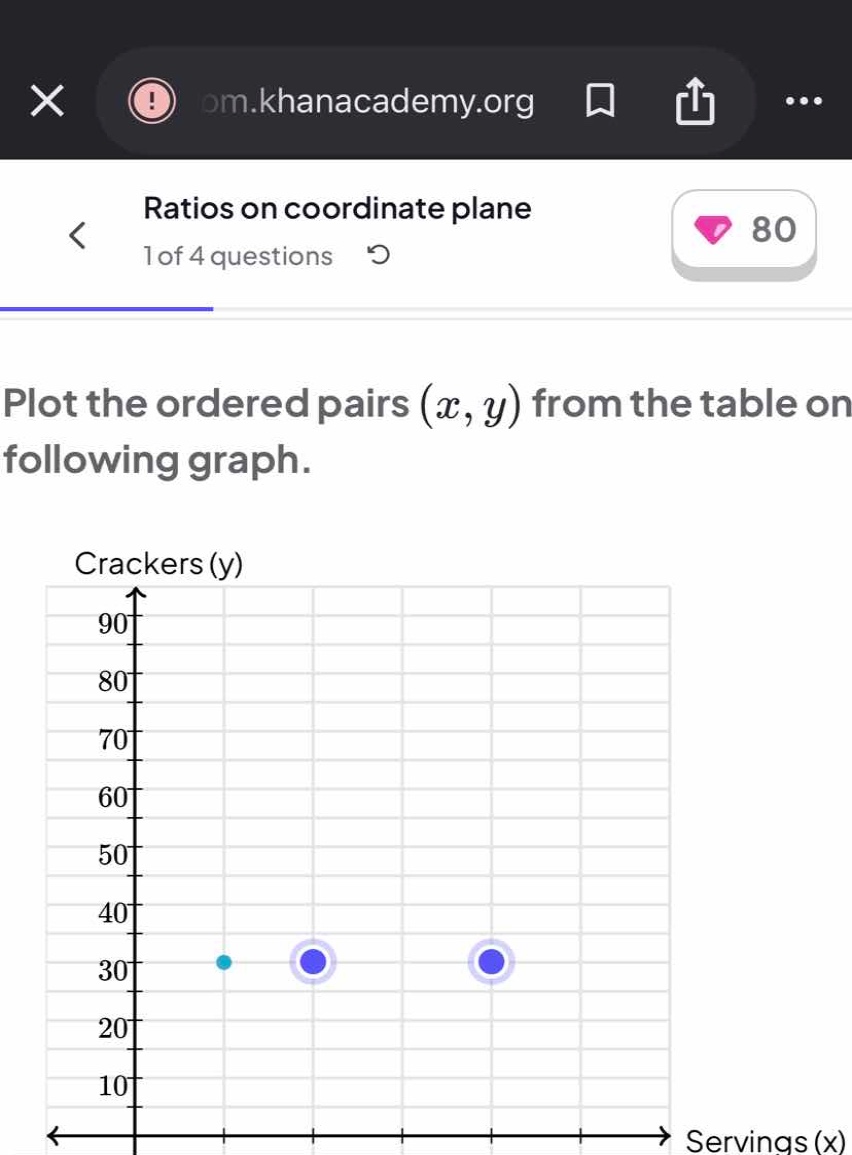
The image is cropped and does not show the table containing the ordered pairs \((x, y)\). However, we can determine the correct ratio and points from the context of "Ratios on coordinate plane" and the visible elements on the graph.
On the graph, there is a fixed small turquoise point plotted at \((1, 30)\). This represents the unit rate of the ratio:
Determine the ordered pairs
Using the constant ratio of \(30\) crackers per serving, the relationship is:
We can find the corresponding \(y\)-values for the integer serving sizes \(x\) shown on the horizontal axis:
- For \(x = 1\): \(y = 30 \times 1 = 30 \implies (1, 30)\) (already plotted as a guide)
- For \(x = 2\): \(y = 30 \times 2 = 60 \implies (2, 60)\)
- For \(x = 3\): \(y = 30 \times 3 = 90 \implies (3, 90)\)
Locate the interactive points
The graph shows two interactive purple plotting rings currently sitting at:
- \((2, 30)\)
- \((4, 30)\)
To correctly plot the ordered pairs from the ratio table, these interactive points must be moved to their correct vertical positions on the grid lines.
Calculate correct coordinates
Using our ratio relationship \(y = 30x\):
- Move the point at \(x = 2\) from \(y = 30\) up to \(y = 60\).
- Move the point at \(x = 3\) (or the second interactive point) to its correct position. Since the grid has vertical lines at \(x = 1, 2, 3, 4, 5\), the standard points for this Khan Academy exercise are:
- \((1, 30)\)
- \((2, 60)\)
- \((3, 90)\)

Snap & solve any problem in the app
Get step-by-step solutions on Sovi AI
Photo-based solutions with guided steps
Explore more problems and detailed explanations
To plot the ordered pairs from the ratio table, use the constant ratio of \(30\) crackers per serving (\(y = 30x\)):
- Keep the guide point at \((1, 30)\).
- Drag the first interactive purple point to \((2, 60)\).
- Drag the second interactive purple point to \((3, 90)\).