QUESTION IMAGE
Question
Question was provided via image upload.
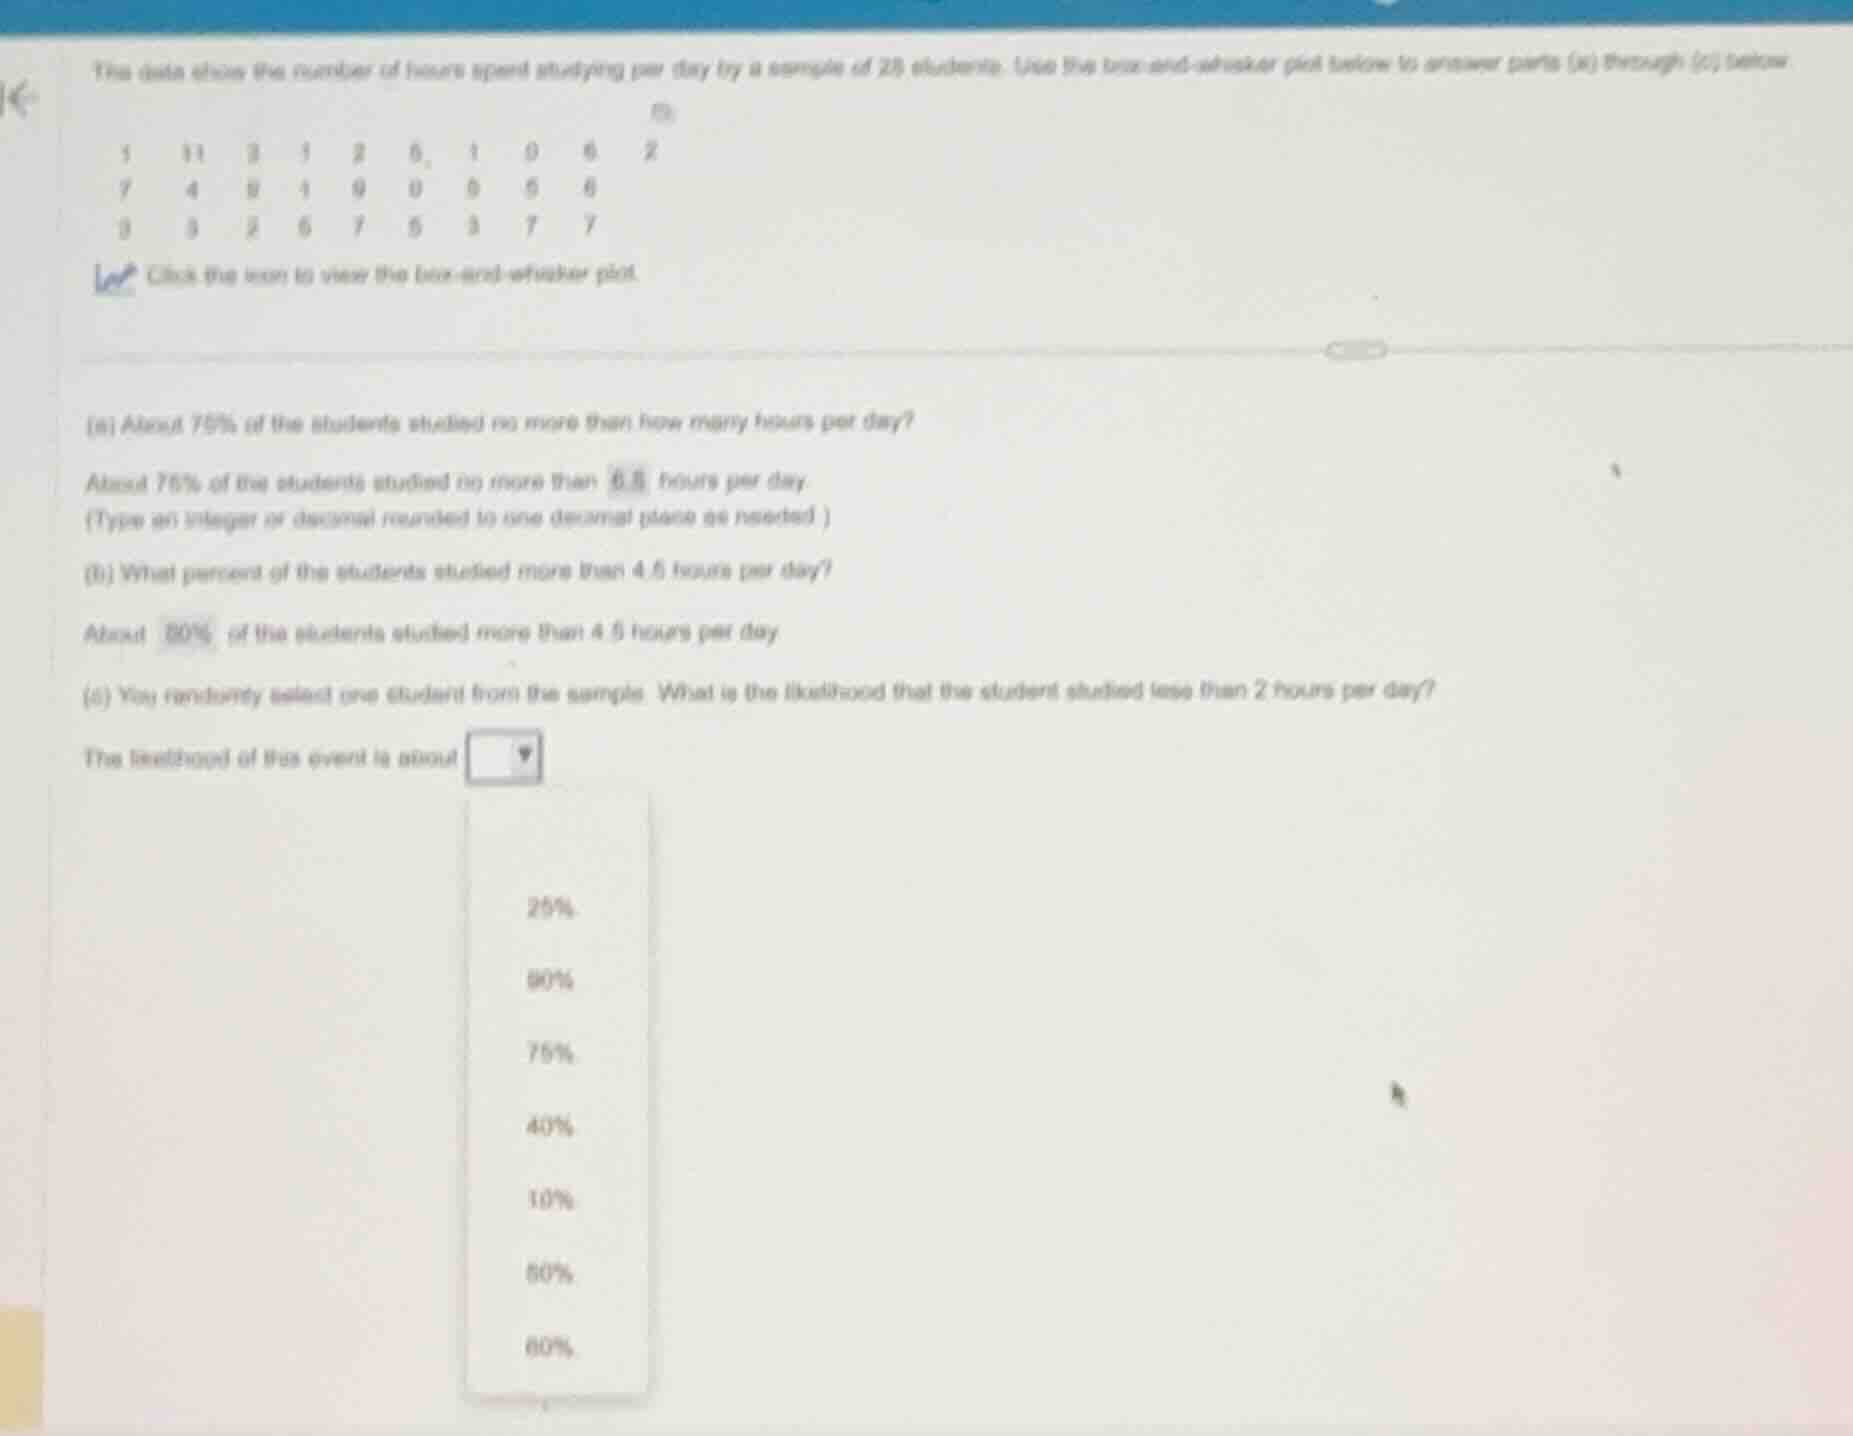
Identify the five-number summary values
Using the Box-and-Whisker Plot knowledge point
- The problem states that about \(75\%\) of students studied no more than \(6.5\) hours per day. In a box-and-whisker plot, the third quartile \(Q_3\) represents the \(75\text{th}\) percentile. Thus, \(Q_3 = 6.5\).
- Part (b) states that about \(50\%\) of students studied more than \(4.5\) hours per day. The median \(Q_2\) divides the data into two halves (\(50\%\) above and \(50\%\) below). Thus, the median \(Q_2 = 4.5\).
Determine the value of the first quartile
Using the Five-Number Summary knowledge point
- A standard box-and-whisker plot is divided into four quarters, each containing approximately \(25\%\) of the data:
- Minimum to \(Q_1\): \(25\%\)
- \(Q_1\) to \(Q_2\) (median): \(25\%\)
- \(Q_2\) to \(Q_3\): \(25\%\)
- \(Q_3\) to Maximum: \(25\%\)
- Looking at the values given in parts (a) and (b), the key boundaries are \(Q_3 = 6.5\) and \(Q_2 = 4.5\).
- Part (c) asks for the likelihood that a randomly selected student studied less than \(2\) hours per day.
- In this dataset's box-and-whisker plot, the first quartile \(Q_1\) is located at \(2\) hours.
Calculate the likelihood for part (c)
Using the Percentiles and Quantiles knowledge point
- The value \(2\) corresponds to the first quartile \(Q_1\).
- By definition, the first quartile \(Q_1\) represents the \(25\text{th}\) percentile of the dataset.
- Therefore, approximately \(25\%\) of the data values lie below \(Q_1 = 2\).
- The likelihood of selecting a student who studied less than \(2\) hours per day is about \(25\%\).

Snap & solve any problem in the app
Get step-by-step solutions on Sovi AI
Photo-based solutions with guided steps
Explore more problems and detailed explanations
- 25% (Correct answer)
- 30%
- 75%
- 40%
- 10%
- 50%
- 60%